13+ Free Sales Tracker Excel Templates for 2026
A sales tracker Excel template gives you a single place to log prospects, track deal stages, forecast revenue, and spot bottlenecks without paying monthly CRM fees. It works as a structured spreadshee...

A sales tracker Excel template gives you a single place to log prospects, track deal stages, forecast revenue, and spot bottlenecks without paying monthly CRM fees. It works as a structured spreadsheet with pre-built columns for contact details, deal values, close dates, and status updates, plus formulas that calculate pipeline totals and win rates automatically. For solo sellers, small teams, and service businesses managing fewer than 100 active deals, a well-designed template delivers most of the visibility you need at zero cost.
Spreadsheets remain practical in 2026 because they adapt to any sales process. You control the layout, add custom fields in seconds, and export data without vendor lock-in. According to recent industry surveys, 66% of companies still utilize spreadsheet-based forecasting in 2026, proving that Excel and Google Sheets continue to serve as the backbone of revenue operations despite the proliferation of specialized sales tools. A good template turns a blank grid into a functional pipeline dashboard in under an hour.
The downside shows up when deal volume climbs or multiple reps need simultaneous access. Manual entry invites typos, version conflicts multiply across shared files, and reporting becomes a copy-paste chore. But for early-stage businesses, freelancers, and teams testing a new product line, a sales tracker template offers the fastest path from chaos to clarity.
When to Use a Sales Tracker Excel Template vs. a Full CRM System
Use a spreadsheet tracker when your monthly deal count stays below 50, your sales cycle runs shorter than 90 days, and one or two people handle all the follow-ups. Templates shine for service providers, consultants, real estate agents, and small e-commerce operations where the sales process is straightforward and relationship complexity stays low. You can update the tracker daily, filter by stage or rep, and generate weekly reports with a few clicks.
Switch to a dedicated CRM when you hire your third sales rep, when deals involve multiple touchpoints across email and phone, or when you need automated reminders and integration with marketing tools. If you catch yourself emailing the latest version of the spreadsheet back and forth, or if you lose deals because someone forgot to follow up, those are clear signals that manual tracking has become a bottleneck. CRMs add cost and learning curve, but they eliminate version chaos and automate repetitive tasks.
The middle ground exists too. Many teams run a spreadsheet tracker for six to twelve months, then migrate to a CRM once they prove product-market fit and secure funding. This approach keeps early expenses low and forces you to define your sales stages clearly before locking into software. Just make sure you export and back up your spreadsheet data regularly so migration doesn't mean starting from scratch.
Key Features Every 2026 Sales Tracker Excel Template Should Include
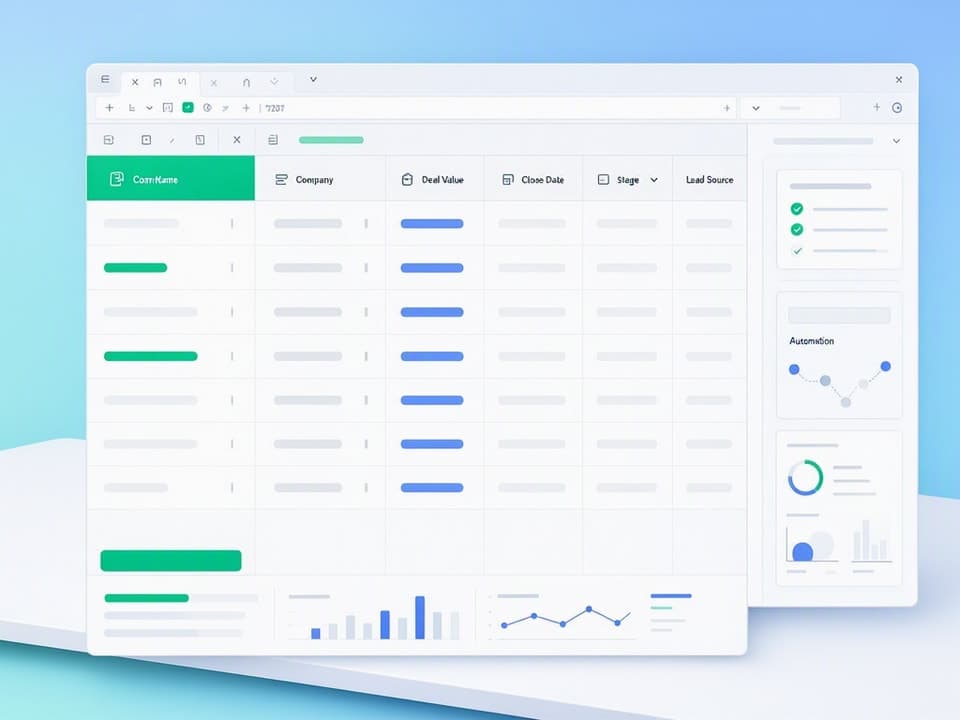
A functional sales tracker starts with a clean column structure that captures the minimum viable data set: contact name, company, deal value, expected close date, current stage, lead source, assigned rep, and a notes field. These columns let you filter by stage, sort by close date, and calculate pipeline totals without scrolling through unnecessary fields. Add more columns only when they serve a specific reporting or follow-up need.
Built-in formulas separate a static list from a live dashboard. Use SUM to calculate total pipeline value, AVERAGE for deal size, COUNTIF to count deals in each stage, and conditional logic to forecast weighted revenue based on stage probability. For example, a formula like =SUMIF(Stage,"Proposal",DealValue)*0.5 gives you a realistic revenue forecast by applying a 50% close probability to all deals in the proposal stage. These formulas update instantly when you change a deal status or add a new row.
Conditional formatting turns numbers into visual signals. Set rules to highlight deals with close dates in the past seven days in orange, flag high-value opportunities above $10,000 in green, and mark stale deals with no activity in 30 days in red. This color-coding lets you scan the tracker in seconds and prioritize follow-ups without reading every row. Modern templates also consider mobile use, keeping column counts low enough to view on a tablet and using freeze panes to lock headers in place during scrolling.
Clear Column Structure for Leads, Contacts, and Deal Stages
Start with contact basics: first name, last name, company, email, and phone. Keep these in the leftmost columns so they stay visible when you scroll right. Next add deal-specific fields: deal value, product or service type, expected close date, and current stage. Use a single "Stage" column with a dropdown menu rather than separate columns for each stage, which bloats the layout and complicates filtering.
Lead source matters for attribution and marketing analysis. Add a dropdown column with options like "Website", "Referral", "Cold Outreach", "Event", and "Partner". This lets you filter by source and calculate which channels deliver the highest close rates. Include an "Owner" column if multiple reps share the tracker, and a "Last Contact Date" field to surface deals that need attention.
Reserve the final column for open-ended notes: call summaries, objections, next steps, or special requirements. This field catches context that doesn't fit structured columns but helps you remember the conversation when you return to the deal three weeks later. Keep notes concise so the tracker stays scannable.
Built-In Formulas for Revenue Forecasting and Win Rate Calculations
Place summary formulas in a dedicated section above or beside your data table. Calculate total pipeline value with =SUM(DealValue), average deal size with =AVERAGE(DealValue), and deal count with =COUNTA(ContactName). For win rate, divide closed-won deals by total closed deals: =COUNTIF(Stage,"Closed-Won")/COUNTIFS(Stage,"Closed-Won")+COUNTIFS(Stage,"Closed-Lost").
Weighted pipeline forecasting multiplies deal value by stage probability. Assign probabilities based on historical close rates: 10% for initial contact, 25% for qualified, 50% for proposal sent, 75% for negotiation, and 100% for closed-won. Use a helper column to calculate weighted value for each deal: =DealValue*StageProbability, then sum that column for your forecast. This approach gives you a realistic revenue projection instead of assuming every open deal will close.
Monthly and quarterly breakdowns help with budgeting and capacity planning. Use SUMIFS to total deal values by close month: =SUMIFS(DealValue,CloseDate,">=2026-07-01",CloseDate,"<2026-08-01"). Copy this formula across columns for each month to build a revenue timeline. Update close dates as deals slip or accelerate, and the forecast adjusts automatically.
Conditional Formatting to Highlight Hot Leads and Overdue Follow-Ups
Select your "Close Date" column and apply a rule that turns cells orange when the date falls within the next seven days. This gives you a visual alert for deals that need immediate attention. Add a second rule to turn past-due dates red so you can quickly identify slipped deals that require renegotiation or disqualification.
Highlight high-value opportunities by selecting the "Deal Value" column and creating a rule that fills cells green when the value exceeds your threshold, such as $10,000 or three times your average deal size. This keeps your biggest opportunities visible even when the tracker grows to 50 or 100 rows.
Use a formula-based rule to flag stale deals. Add a helper column that calculates days since last contact: =TODAY()-LastContactDate. Apply conditional formatting to the entire row when this value exceeds 30 days, shading it light gray to indicate the deal needs a follow-up call or should be marked as lost. This automation removes the guesswork from pipeline hygiene.
Types of Sales Tracker Templates: Which One Fits Your Workflow?
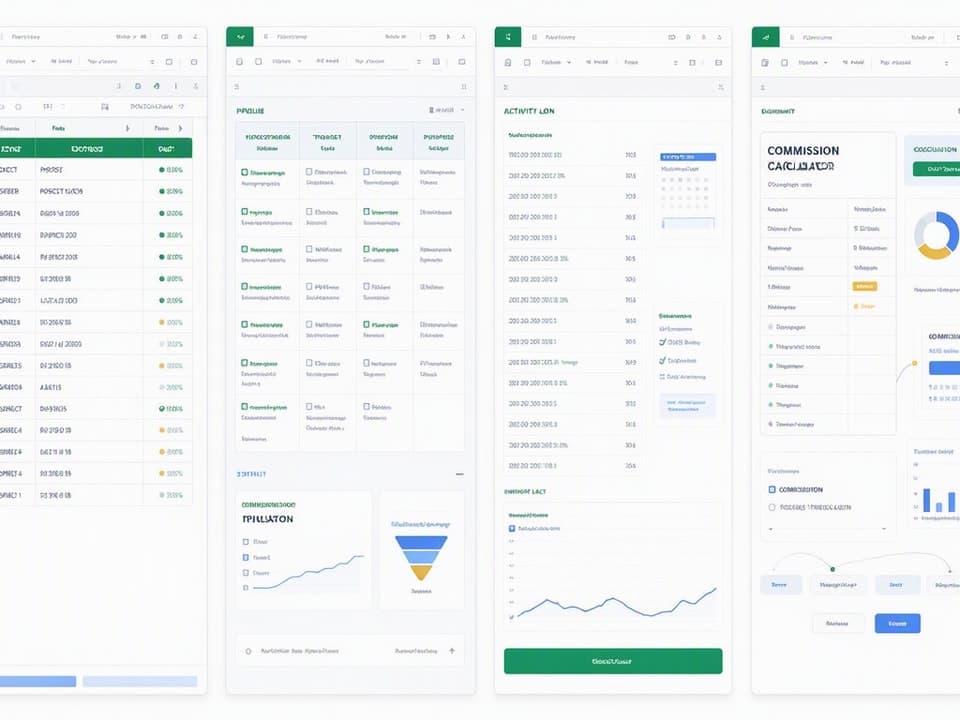
Sales tracker templates fall into four main categories, each designed for a specific stage or style of selling. Prospect and lead trackers focus on early-stage pipeline management, capturing contact information and qualification status before deals form. Sales pipeline managers track deal progression through defined stages with forecasted close dates and revenue values. Sales activity logs emphasize actions over outcomes, recording calls, emails, and meetings to measure effort and identify productivity gaps. Commission and performance trackers calculate payouts and compare individual rep results against quota.
Choose based on what you need to measure. If you spend most of your time qualifying inbound leads and deciding which ones to pursue, start with a prospect tracker. If you manage a multi-stage sales cycle with clear milestones, use a pipeline manager. If your sales model rewards activity volume and you need to prove you made 50 calls this week, grab an activity log. If you run a team and need to calculate variable compensation, pick a commission tracker. You can combine elements from multiple types into a single custom template once you understand your core reporting needs.
Most small teams start with a pipeline manager because it balances lead capture, stage tracking, and revenue forecasting in one view. You can always add an activity log tab or a commission calculator sheet later as your process matures.
Prospect and Lead Tracker Templates
A prospect tracker captures contact details, lead source, qualification score, and next steps before a deal officially enters your pipeline. It works as a holding area for cold outreach responses, event contacts, and referrals that need vetting. Columns include first name, last name, company, title, email, phone, lead source, qualification status (cold, warm, hot), last contact date, and next action.
Use this template when you generate high volumes of leads but only a fraction convert to active opportunities. It helps you prioritize follow-up based on lead temperature and prevents promising contacts from falling through the cracks. Add a "Disqualified" status and a reason column so you can analyze why leads don't progress and refine your targeting over time.
Service providers and consultants benefit most from prospect trackers because their sales cycles often start with exploratory conversations that may or may not turn into projects. The tracker gives structure to the discovery phase without forcing you to forecast revenue before you understand the scope.
Sales Pipeline Manager Templates
A pipeline manager tracks deals from first contact to closed-won, with columns for deal stage, forecasted close date, deal value, product or service type, and probability-weighted revenue. Stages typically include "Initial Contact", "Qualified", "Proposal Sent", "Negotiation", "Closed-Won", and "Closed-Lost". Each row represents one active opportunity, and you move deals across stages as they progress.
This template type delivers the most value for teams with defined sales processes and deal cycles longer than two weeks. It provides a real-time snapshot of pipeline health, highlights bottlenecks where deals stall, and generates revenue forecasts that inform hiring and inventory decisions. Add a "Days in Stage" helper column to identify deals that sit too long in one phase, signaling a need for re-engagement or disqualification.
Pipeline managers work well for B2B sales, wholesale accounts, real estate transactions, and any scenario where multiple touchpoints occur between initial interest and signed contract. The visual clarity of seeing all deals in one view helps sales managers coach reps and allocate resources to the highest-value opportunities.
Sales Activity Log Templates
An activity log records daily actions rather than deal outcomes. Columns include date, rep name, activity type (call, email, meeting, demo), contact name, company, duration, outcome, and notes. Each row captures a single touchpoint, so a deal with ten interactions generates ten rows. Summary formulas count activities by type and rep, revealing who makes the most calls and which activity types correlate with closed deals.
Use this template when your sales model rewards volume and consistency, such as outbound prospecting or inside sales roles with daily call quotas. It helps managers identify coaching opportunities and ensures reps maintain momentum even during slow deal cycles. Pair the activity log with a pipeline manager to connect effort with results.
Activity logs also serve as a personal accountability tool for solo sellers. Logging every call and email creates a record you can review weekly to spot patterns, such as higher conversion rates on Tuesday mornings or better response rates from specific industries. This data-driven approach removes guesswork from scheduling and targeting.
Commission and Performance Tracker Templates
A commission tracker calculates payouts based on closed deals, quota attainment, and bonus tiers. Columns include rep name, deal value, close date, commission rate, commission amount, quota, attainment percentage, and bonus eligibility. Formulas multiply deal value by commission rate, sum totals by rep, and compare results against quota to determine bonus payouts.
This template matters most for teams with variable compensation plans and multiple reps. It provides transparency into earnings, reduces disputes over payouts, and helps reps forecast their income based on pipeline. Add tabs for monthly, quarterly, and annual views so reps can track progress toward accelerators and year-end bonuses.
Performance trackers extend beyond commissions to include metrics like win rate, average deal size, sales cycle length, and activities per closed deal. These benchmarks help managers identify top performers and coach underperformers. Use conditional formatting to highlight reps who exceed quota in green and those below target in red, creating a visual leaderboard that drives healthy competition.
Step-by-Step Guide: How to Customize a Sales Tracker Excel Template for Your Business
Customization starts with understanding your actual sales process, not copying someone else's stages. Download a basic template as a starting point, then adapt it to match how you really sell. The goal is a tracker that feels intuitive to update and surfaces the metrics you check daily, not a bloated spreadsheet that looks impressive but never gets used.
Set aside two hours for initial setup. You'll define stages, configure columns, add formulas, lock in data validation, and apply conditional formatting. Once the structure is right, daily updates take less than five minutes. Test the tracker with ten real deals before rolling it out to a team, and adjust based on what feels clunky or unclear.
Save a blank copy as your master template after setup. This lets you start fresh each quarter or year without rebuilding formulas and formatting from scratch.
Step 1: Define Your Sales Stages and Deal Milestones
Map your actual sales process from first contact to signed contract. Write down each distinct phase where a deal changes status or requires a different action. Avoid generic stages like "Prospecting" or "Follow-Up" that don't reflect real milestones. Instead use specific labels like "Discovery Call Scheduled", "Proposal Sent", "Contract Under Review", and "Payment Received".
Limit stages to five or six. More than that creates confusion and makes filtering harder. Each stage should represent a clear decision point or deliverable: the prospect agreed to a demo, you sent pricing, they requested references, legal approved terms. If you can't articulate what moves a deal from one stage to the next, combine or eliminate stages until the progression feels logical.
Test your stage definitions by walking through three recent deals. Can you place each deal in the right stage without hesitation? Do the stages capture the critical moments where deals accelerate or stall? Adjust until the framework matches reality, not an idealized sales process from a textbook.
Step 2: Set Up Columns for Key Data Points
Start with eight core columns: Contact Name, Company, Deal Value, Close Date, Stage, Lead Source, Owner, and Notes. Place them in that order from left to right so contact details stay visible when you scroll. Use short, clear headers like "Deal $" instead of "Estimated Contract Value" to keep the layout compact.
Add optional columns based on your business model. Product or service type matters if you sell multiple offerings and need to analyze performance by category. Last contact date helps with follow-up discipline. Probability percentage supports weighted forecasting. Competitor field tracks who you're up against. Only add columns you'll actually update and reference, not fields that sound useful but sit empty.
Format columns appropriately. Set "Deal Value" as currency with no decimals. Format "Close Date" as a short date like "7/15/26". Use text format for names and companies to prevent Excel from auto-correcting entries. Freeze the top row and first two columns so headers and contact names stay visible during scrolling.
Step 3: Add Formulas for Automatic Calculations
Create a summary section above your data table with key metrics. In cell B2, add =SUM(D:D) to total pipeline value, assuming column D holds deal values. In B3, use =AVERAGE(D:D) for average deal size. In B4, calculate deal count with =COUNTA(A:A)-1 to exclude the header row.
Add stage-specific totals in a separate area. List each stage name in column G, then use SUMIF formulas in column H to sum deal values by stage: =SUMIF(E:E,"Proposal Sent",D:D). This shows how much revenue sits in each phase of your pipeline. Copy the formula down for each stage, changing the stage name in quotes to match your list.
Build a weighted forecast by adding a helper column that multiplies deal value by stage probability. If column E holds stages and column D holds values, add a new column F with a formula like =IF(E2="Initial Contact",D2*0.1,IF(E2="Proposal Sent",D2*0.5,IF(E2="Negotiation",D2*0.75,0))). Adjust probabilities based on your historical close rates. Sum column F for your weighted pipeline total.
Step 4: Apply Data Validation and Dropdown Lists
Select the entire "Stage" column below the header. Go to Data > Data Validation > List, then enter your stage names separated by commas: "Initial Contact, Qualified, Proposal Sent, Negotiation, Closed-Won, Closed-Lost". This creates a dropdown menu that prevents typos and ensures consistent entries. Do the same for "Lead Source" and "Owner" columns using your actual sources and rep names.
Lock in date formatting by selecting the "Close Date" column and applying data validation with a date rule. Set a minimum date of today and a maximum date one year out to catch accidental entries. This prevents someone from typing "next Tuesday" or entering a date in 2026 by mistake.
Protect the formula cells so users can't accidentally delete or overwrite calculations. Select all cells with formulas, right-click, choose Format Cells > Protection, and check "Locked". Then go to Review > Protect Sheet, uncheck "Select locked cells", and set a password. Users can still edit data rows but can't break your summary formulas.
Step 5: Use Conditional Formatting to Visualize Progress
Select your "Close Date" column and go to Home > Conditional Formatting > New Rule > Format cells that contain > Cell Value > between > TODAY() and TODAY()+7. Set the fill color to light orange. Add a second rule for dates less than TODAY() with a red fill. This highlights upcoming and overdue close dates without manual tagging.
Apply value-based formatting to the "Deal Value" column. Create a rule where cell value is greater than your high-value threshold, such as 10000, and set the fill to light green. This makes big opportunities stand out instantly. Use a yellow fill for mid-range deals if you want three tiers of visual priority.
Add a formula-based rule to flag stale deals. Insert a helper column that calculates days since last contact: =TODAY()-LastContactDate. Select your entire data range, create a new conditional formatting rule with "Use a formula to determine which cells to format", and enter =$J2>30 (assuming column J holds your days-since-contact calculation). Format the entire row with a light gray fill to indicate the deal needs attention.
Real-World Sales Tracker Examples: Templates in Action
Seeing a tracker in context makes the structure click. These three examples show how different businesses adapt the same core template to their specific workflows, proving that customization doesn't mean complexity.
Example 1: Service-Based Business Tracking Consulting Leads
A freelance marketing consultant manages 15 active leads at any time. Her tracker includes columns for contact name, company, service type (SEO audit, content strategy, paid ads), project value, discovery call date, proposal sent date, stage, and next action. She uses four stages: "Initial Contact", "Discovery Scheduled", "Proposal Sent", and "Closed". A simple SUM formula totals her pipeline, and conditional formatting highlights proposals older than 14 days in yellow.
She updates the tracker every morning after checking email, adding new leads from her website contact form and moving existing leads across stages. The "Next Action" column keeps her focused: "Send case study", "Follow up on pricing question", "Schedule kickoff call". At the end of each week, she filters by "Closed" to calculate revenue and archives those rows to a separate "Won Deals" tab for reference.
This minimal setup takes her three minutes per day to maintain and gives her a clear view of where each opportunity stands. She exports the tracker to PDF monthly for her accountant and uses the pipeline total to decide when she can afford to hire a subcontractor.
Example 2: E-Commerce Store Monitoring Wholesale Pipeline
An online home goods retailer tracks 25 wholesale accounts in various stages of negotiation. The tracker includes columns for buyer name, company, product category, order quantity, unit price, total order value, expected delivery date, stage, and payment terms. Stages include "Initial Inquiry", "Sample Sent", "Pricing Negotiation", "PO Received", and "Shipped". A weighted forecast multiplies order value by stage probability to estimate quarterly revenue.
The owner updates the tracker after each buyer call and when samples ship. Conditional formatting flags orders with delivery dates in the next two weeks in green, signaling the need to coordinate with the warehouse. A SUMIF formula breaks down pipeline value by product category, helping her decide which inventory to prioritize for production.
She shares a view-only copy of the tracker with her fulfillment partner so they can see upcoming orders and plan capacity. The tracker replaced a scattered system of email threads and sticky notes, reducing missed deadlines and improving cash flow visibility.
Example 3: Real Estate Agent Managing Property Showings and Offers
A residential real estate agent tracks 30 active buyers and 12 listings using a dual-tab tracker. The "Buyers" tab includes columns for buyer name, budget range, preferred neighborhoods, pre-approval status, showing dates, properties viewed, and offer status. The "Listings" tab tracks property address, list price, showing count, offer count, highest offer, and contract status.
He updates the tracker after every showing and when offers come in. Conditional formatting highlights buyers who haven't scheduled a showing in 21 days, prompting a check-in call. A COUNTIF formula on the "Listings" tab shows which properties generate the most interest, informing pricing strategy for future listings.
The tracker helps him match buyers to properties by filtering the "Buyers" tab by neighborhood and budget, then cross-referencing against available listings. He exports the tracker to PDF monthly for his broker and uses the offer data to demonstrate market trends to new clients. The system keeps him organized during busy spring and summer selling seasons when managing all the details in his head becomes impossible.
Common Mistakes to Avoid When Using Sales Tracker Excel Templates
Even a well-designed tracker fails if you use it inconsistently or overcomplicate the structure. These four mistakes account for most tracker abandonment, and each has a straightforward fix.
Overcomplicating the Template with Too Many Columns
Adding columns for every possible data point creates a bloated spreadsheet that takes ten minutes to update and requires horizontal scrolling to view. You lose the at-a-glance clarity that makes trackers useful. Stick to fields you reference daily or weekly, not information that might be useful someday. If you haven't filtered or reported on a column in 30 days, delete it.
Resist the urge to track granular details like "Decision-Maker's Assistant's Name" or "Competitor Pricing Notes" unless they directly inform your next action. Use the "Notes" column for one-off details that don't justify a dedicated field. Simplicity wins because it lowers the friction to update the tracker, which is the only thing that matters for long-term adoption.
Review your column list monthly and prune anything that sits empty or unused. A lean tracker with eight well-maintained columns beats a comprehensive tracker with 20 columns where half the data is stale or missing.
Failing to Update the Tracker Consistently
A tracker only works if it reflects current reality. Updating once a week or "when you remember" turns the tool into a historical record rather than a decision-making dashboard. Stale data leads to missed follow-ups, inaccurate forecasts, and lost deals. Set a daily update routine, ideally at the same time each day, such as first thing in the morning or right before you leave the office.
Use calendar reminders or task management apps to build the habit. Treat tracker updates like checking email, not like filing expense reports. The update should take less than five minutes if your column structure is simple. Log new leads, move deals across stages, update close dates, and add quick notes about recent conversations.
If you manage a team, make tracker updates a standing agenda item in weekly one-on-ones. Review each rep's pipeline together, update stages and close dates in real time, and discuss follow-up strategies. This accountability loop prevents the tracker from drifting out of sync with reality.
Not Backing Up or Version-Controlling Your Sales Data
Storing your tracker only on your laptop invites disaster. Hard drives fail, files corrupt, and accidental deletions happen. Save your tracker to a cloud service like Google Drive, OneDrive, or Dropbox so it syncs automatically and remains accessible from multiple devices. Enable version history so you can restore previous versions if someone overwrites critical data or formulas.
Use a clear naming convention with dates: "Sales-Tracker-2026-Q3.xlsx". Create a new copy each quarter and archive the old version to a "Historical" folder. This prevents the file from growing too large and makes it easier to compare performance across time periods. Export a backup CSV weekly and store it separately from the main file.
If multiple people share the tracker, use Excel's "Share Workbook" feature or migrate to Google Sheets for real-time collaboration. Avoid
Get the newsletter
One sharp idea every Sunday.
No fluff. No sales pitches. Just the best of what we publish, hand-picked.
Continue Reading
Related Articles
2026 Excel Payroll Templates: Ultimate Guide & Free Downloads
Running payroll in Excel still works in 2026. Small business owners with 2-10 employees, HR teams managing seasonal workers, and freelancers paying contractors rely on payroll spreadsheet templates to...
10 Free Excel Project Management Templates for 2026
Excel project management templates handle 80% of tracking needs for teams under 25 people without monthly software fees. They run offline, require zero onboarding, and give you full control over formu...

10+ Free Employee Attendance Tracker Excel Templates for 2026
Small businesses waste thousands of hours each year tracking attendance manually or patching together inconsistent spreadsheets. An employee attendance tracker Excel template gives you a structured, f...