Google Sheets AI: 7 Powerful Tools & the New =AI() Function (2026)
Google Sheets stopped being just a place to store numbers the moment AI moved in. As of June 2026, you can ask a spreadsheet to score leads, categorize customer feedback, write formulas in plain Engli...

Google Sheets stopped being just a place to store numbers the moment AI moved in. As of June 2026, you can ask a spreadsheet to score leads, categorize customer feedback, write formulas in plain English, and pull live data from a dozen platforms without touching a single API endpoint. The shift happened fast: Google's Gemini integration became standard in Workspace accounts, the =AI() function went multilingual in late 2025, and the March 2026 update taught Gemini to solve optimization problems and synthesize context across your entire Drive.
Manual data entry, repetitive formulas, and time-consuming analysis are productivity killers that AI tools can now eliminate in seconds. This guide covers Google's native AI features, the seven most useful third-party tools for Sheets, and the exact workflows that turn a blank spreadsheet into a self-updating dashboard. You'll learn when to trust AI, when to audit it, and how to pick the right tool for sales forecasting, sentiment tracking, inventory management, and marketing attribution.
What Is AI in Google Sheets and Why It Matters in 2026
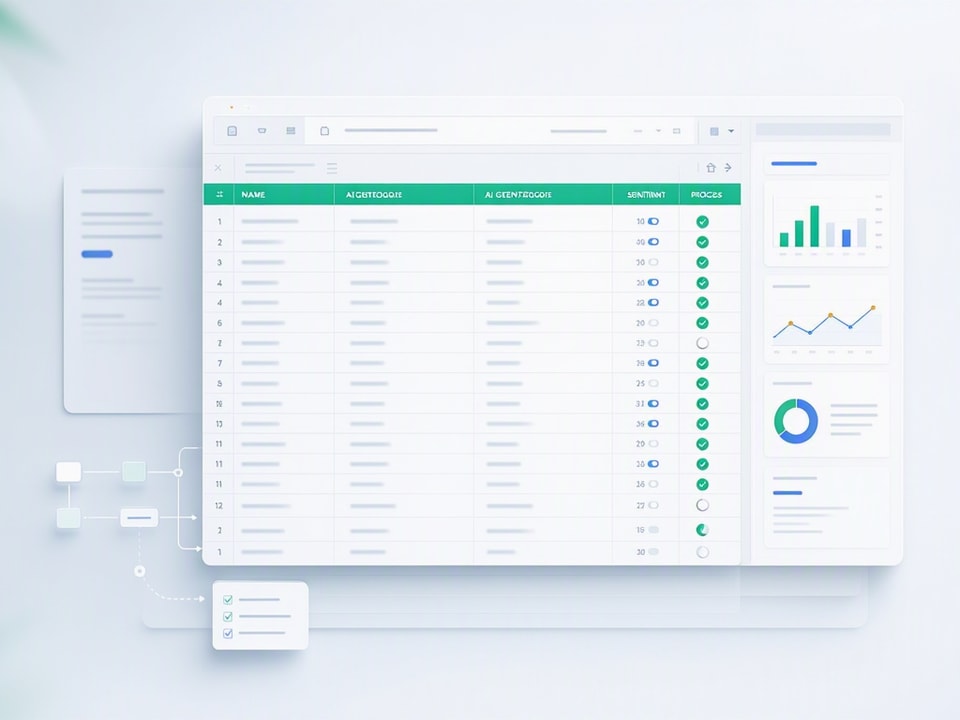
AI in Google Sheets means three things in June 2026: native Gemini integration that writes formulas and answers questions about your data, the =AI() function that processes text and categorizes information inside cells, and third-party add-ons that sync live data from CRMs, ad platforms, and databases. Google rolled out Gemini to all Workspace accounts in 2025, then expanded the =AI() function to support multiple languages in late 2025, making it accessible to global teams. The March 2026 update substantially raised the ceiling for what Gemini can do inside Sheets: it now handles complex optimization problems, synthesizes context from across your Drive, and can build full spreadsheets from scratch via natural language.
Why this matters: you no longer need to know VLOOKUP syntax, regular expressions, or Apps Script to automate a sales pipeline report. You describe what you want, Gemini writes the formula, and =AI() fills in the analysis. The gap between "I need this data organized" and "here's a working dashboard" collapsed from hours to minutes.
The trade-off is accuracy. AI-generated formulas can reference the wrong range, hallucinate column names, or produce plausible-looking results that fail under edge cases. Every AI output needs a human check, especially for financial calculations, compliance reporting, and anything that feeds a decision with real consequences.
Google Sheets Native AI: Gemini, =AI(), and Smart Fill
Google's built-in AI lives in three places: the Gemini sidebar for natural language queries and formula generation, the =AI() function for text processing and categorization inside cells, and Smart Fill for pattern recognition during data entry. All three ship free with Google Workspace accounts as of June 2026, no add-ons required.
Gemini sits in the right sidebar and responds to prompts like "create a pivot table showing revenue by product category" or "write a formula to calculate days until contract renewal." It reads your sheet structure, suggests formulas, and explains what each function does. The March 2026 update added cross-Drive context, so Gemini can pull information from Docs, Slides, and other Sheets to answer questions like "which clients mentioned pricing concerns in last month's meeting notes?"
The =AI() function runs inside cells and handles tasks that used to require custom scripts: sentiment analysis, data categorization, text extraction, and simple transformations. Smart Fill watches you type and predicts the next value based on patterns in adjacent columns. It works well for standardizing city names, extracting email domains, and filling in product categories, but it guesses wrong often enough that you should always review its suggestions before applying them to a full column.
The =AI() Function: Syntax, Use Cases, and Limitations

The =AI() function takes a text prompt and an optional cell reference, then returns a result based on that instruction. Basic syntax: =AI("prompt", A2) where A2 contains the data you want to process. Practical examples: =AI("Extract the company name from this email signature", B2) pulls out the organization, =AI("Categorize this product review as Positive, Neutral, or Negative", C2) scores sentiment, and =AI("Translate this phrase to Spanish", D2) handles simple translations.
Use it for lead scoring by asking =AI("Rate this lead description as Hot, Warm, or Cold based on urgency and budget signals", E2). Use it for content tagging by prompting =AI("Assign one primary topic to this blog title: SEO, Social Media, Email Marketing, or Analytics", F2). Use it for data cleaning by writing =AI("Standardize this company name to its official format", G2) when you have inconsistent entries like "Microsoft Corp" and "MSFT."
Limitations hit fast. The function has a token limit per cell, so long text inputs get truncated. Complex instructions produce inconsistent results because the underlying model interprets prompts differently across rows. It cannot reference other sheets, perform calculations, or chain logic the way traditional formulas can. If you need to process more than a few hundred rows, expect slower performance and occasional errors. For bulk operations, third-party tools like Numerous.ai handle volume better.
Gemini Sidebar: Natural Language Queries and Cross-Drive Context
The Gemini sidebar turns spreadsheet work into a conversation. You type "show me which sales reps closed the most deals in Q1" and Gemini writes the formula, inserts a pivot table, or highlights the relevant rows. It reads your column headers, detects data types, and suggests the most efficient approach. The March 2026 update substantially raised its capabilities: it now synthesizes context from across your Drive, so you can ask "which action items from last week's project meeting are still incomplete?" and it pulls data from linked Docs and Sheets.
Use Gemini for formula help when you forget syntax. Type "how do I count unique values in column B?" and it writes =COUNTA(UNIQUE(B:B)) with an explanation. Use it for data insights by asking "what trends do you see in this monthly revenue table?" and it identifies growth periods, seasonal dips, and outliers. Use it for automation setup by prompting "create a conditional formatting rule that highlights rows where column D is overdue" and it applies the rule without you opening the formatting menu.
Cross-Drive context makes Gemini useful for project tracking. If your meeting notes live in a Doc and your task list lives in a Sheet, Gemini can answer "which tasks are assigned to Sarah and mentioned in this week's notes?" by reading both files. This works best when files are organized in the same Drive folder and share consistent naming conventions.
The sidebar cannot execute Apps Script, trigger external APIs, or make changes without your confirmation. It suggests, you approve. This keeps you in control but adds a manual step to every automation.
Smart Fill and Auto-Complete: When AI Predicts Your Next Move
Smart Fill watches the first few entries in a column and predicts the rest based on patterns it detects. Type "San Francisco" in A2, "California" in B2, "Los Angeles" in A3, and "California" in B3, then start typing "San" in A4. Smart Fill suggests "San Diego" and auto-fills "California" in B4 if you accept. It works well for standardizing location data, extracting first names from full names, and categorizing products when the pattern is obvious.
When it works: filling in missing state abbreviations from city names, extracting domain names from email addresses, and assigning product categories when the naming convention is consistent. When it fails: complex transformations that require logic (like calculating tax rates based on multiple conditions), data that doesn't follow a clear pattern, and anything that needs accuracy over speed.
Manual formulas are still faster for calculations, conditional logic, and anything that references other sheets. Use Smart Fill for repetitive data entry where a wrong guess is easy to spot and fix. Skip it for financial data, compliance records, and anything that feeds a downstream process without human review.
Top Third-Party AI Tools for Google Sheets in 2026
Native Gemini and =AI() handle general productivity tasks, but third-party add-ons dominate when you need live data sync, bulk AI processing, advanced analytics, or multi-platform automation. The best tools in June 2026 are Coefficient for real-time CRM and database connections, Numerous.ai for batch AI operations on marketing and research data, and Querri for predictive modeling and statistical analysis. Each solves a different bottleneck.
Coefficient connects Google Sheets to Salesforce, HubSpot, MySQL, Snowflake, and 50+ other platforms, then refreshes data automatically on a schedule you set. Numerous.ai runs AI prompts across thousands of rows at once, making it the go-to for SEO keyword research, sentiment scoring, and competitive analysis. Querri adds forecasting, regression, and statistical functions that Google Sheets doesn't offer natively. All three integrate with Sheets as add-ons, so you install them once and access them from the Extensions menu.
Choosing between them depends on your workflow. If you spend time copying data from a CRM into Sheets every week, Coefficient eliminates that step. If you need to categorize 5,000 customer reviews by theme, Numerous.ai processes them in minutes. If you're building sales forecasts or inventory models that require regression analysis, Querri gives you the math Sheets can't do alone.
Coefficient: Live Data Sync and Automated Reporting
Coefficient pulls live data from CRMs, databases, and business platforms directly into Google Sheets, then refreshes it on a schedule you control. Connect Salesforce and your pipeline report updates every morning at 8 AM without manual exports. Connect Stripe and your revenue dashboard reflects yesterday's transactions before you open the sheet. As of June 2026, Coefficient is trusted by over 350,000 professionals worldwide and supports integrations with HubSpot, PostgreSQL, Google Analytics, Shopify, and dozens of other platforms.
The AI features sit on top of the data sync. Coefficient can auto-generate pivot tables, flag anomalies, and send Slack alerts when a metric crosses a threshold. It writes formulas for you using natural language prompts, similar to Gemini but with access to your connected data sources. This makes it useful for building dashboards that combine data from multiple platforms: pull ad spend from Google Ads, revenue from Stripe, and customer count from HubSpot, then let Coefficient calculate ROI and highlight underperforming campaigns.
Use Coefficient when you need real-time data in Sheets without writing API calls or Apps Scripts. Use it for weekly sales reports, marketing attribution dashboards, and inventory tracking when your source data lives in a platform that updates constantly. Skip it if your data is static, updates infrequently, or already lives in Sheets.
Numerous.ai: Bulk AI Processing for Marketing and Research
Numerous.ai specializes in running AI prompts across thousands of rows at once. Upload a list of 5,000 product descriptions and ask it to extract the primary benefit, assign a category, and rate the clarity on a scale of 1 to 10. It processes the entire sheet in minutes, something that would take hours with =AI() due to rate limits and cell-by-cell execution.
Use it for SEO research when you need to categorize 2,000 keywords by search intent, sentiment analysis when you're processing survey responses from a large customer base, and competitive analysis when you're comparing features across hundreds of products. Numerous.ai also handles content generation: write meta descriptions, generate ad copy variations, and create email subject line options based on a brief.
The trade-off is cost. Bulk AI processing burns through API tokens fast, so Numerous.ai charges per operation after a free tier. For one-off projects with large datasets, it's worth the cost. For ongoing work, consider whether you can break the task into smaller batches and use =AI() instead.
Querri: Advanced Analytics and Predictive Modeling
Querri adds statistical functions that Google Sheets lacks: regression analysis, time series forecasting, cohort analysis, and predictive modeling. Use it to forecast next quarter's revenue based on historical trends, calculate customer lifetime value with cohort-based retention curves, and run A/B test significance calculations without exporting data to a separate analytics tool.
The interface works like a formula builder. Select your data range, choose the analysis type, and Querri outputs the results in a new sheet with charts and summary statistics. It explains what each metric means, so you don't need a statistics degree to interpret the output. This makes it useful for small business owners and operators who need forecasting and trend analysis but don't have a dedicated data team.
Use Querri when you're building inventory reorder models, sales forecasts, or marketing attribution reports that require more than basic averages and sums. Skip it if your analysis is simple enough for native Sheets functions like AVERAGE, TREND, and FORECAST.
When to Use Add-Ons vs. Native AI
Choose native Gemini and =AI() when your data lives in Sheets, your tasks are straightforward, and you don't need live connections to external platforms. The built-in tools are free, fast for small datasets, and require no setup beyond enabling Gemini in your Workspace account.
Choose add-ons when you need live data sync, bulk AI operations, or advanced analytics. Coefficient makes sense if you copy data from a CRM or database into Sheets more than once a week. Numerous.ai is worth it if you process thousands of rows with AI prompts regularly. Querri pays off when you need forecasting, regression, or statistical analysis that Sheets can't handle natively.
Cost is the deciding factor for most users. Native AI is free. Add-ons charge monthly subscriptions or per-operation fees. If the add-on saves more time than it costs, use it. If you can accomplish the task with native tools in a reasonable amount of time, skip the subscription.
Practical AI Spreadsheet Use Cases for 2026
AI spreadsheets shine when they eliminate repetitive tasks, automate data updates, and surface insights faster than manual analysis. The workflows below show where AI shortens setup time and improves accuracy in sales, marketing, customer feedback, and inventory management. Each example includes the data structure, AI tools used, and the output you should expect.
Sales Pipeline Analysis: Forecasting and Lead Scoring
Start with a sheet that imports live CRM data using Coefficient or a manual CSV export. Columns: Lead Name, Company, Contact Date, Deal Size, Stage, and Notes. Add a Lead Score column and use =AI("Rate this lead as Hot, Warm, or Cold based on deal size, urgency signals in the notes, and days since last contact", F2) where F2 contains the notes. Drag the formula down to score every lead.
Add a forecast column using =TREND() or Querri's time series analysis to project next month's pipeline value based on historical close rates. Set up conditional formatting to highlight Hot leads in green and overdue follow-ups in red. Automate a weekly email report using Google Apps Script or Coefficient's alert feature to notify the sales team when a lead score changes or a deal moves to the next stage.
This workflow reduces manual lead review time from hours to minutes and catches high-value opportunities before they go cold. The AI scoring is directional, not perfect, so sales reps should review the Hot leads before acting.
Customer Feedback and Sentiment Tracking
Pull survey responses into a sheet with columns for Response ID, Date, Feedback Text, and Rating. Add a Sentiment column and use =AI("Categorize this feedback as Positive, Neutral, or Negative", C2). Add a Theme column and prompt =AI("Assign one primary theme to this feedback: Product Quality, Customer Service, Pricing, Delivery, or Other", C2).
Build a pivot table that counts feedback by sentiment and theme, then add a chart to visualize trends over time. Use conditional formatting to flag Negative feedback with more than 100 words, since longer negative responses often signal serious issues. Set up a dashboard that updates automatically when new responses arrive, so your support team sees patterns without manual analysis.
This workflow turns raw feedback into actionable insights in under an hour. The AI categorization misses nuance, so read a sample of flagged responses to verify the themes make sense.
Marketing Campaign Performance and Attribution
Connect Google Ads, Facebook Ads, and your email platform to Sheets using Coefficient. Columns: Campaign Name, Platform, Spend, Clicks, Conversions, Revenue. Add a ROI column with =(Revenue - Spend) / Spend and a Cost Per Conversion column with =Spend / Conversions. Use Gemini to write a formula that flags campaigns with ROI below 20% or cost per conversion above your target.
Add a Performance Trend column and use Querri or =TREND() to forecast next month's conversions based on the last 90 days. Build a dashboard with charts for spend by platform, ROI by campaign, and conversion trends over time. Automate a weekly report that emails your marketing team when a campaign underperforms.
This workflow consolidates multi-platform data into one view and surfaces underperforming campaigns before they burn through budget. The attribution is last-click unless you build a custom model, so treat the ROI numbers as directional.
Inventory Management and Reorder Automation
Create a sheet with columns for Product Name, SKU, Current Stock, Reorder Point, Supplier, and Last Order Date. Add a Reorder Status column with =IF(Current Stock < Reorder Point, "Order Now", "Sufficient"). Use =AI("Predict demand for this product next month based on sales trend and seasonality", Sales History Range) if you have historical data, or use Querri's forecasting feature for more accurate predictions.
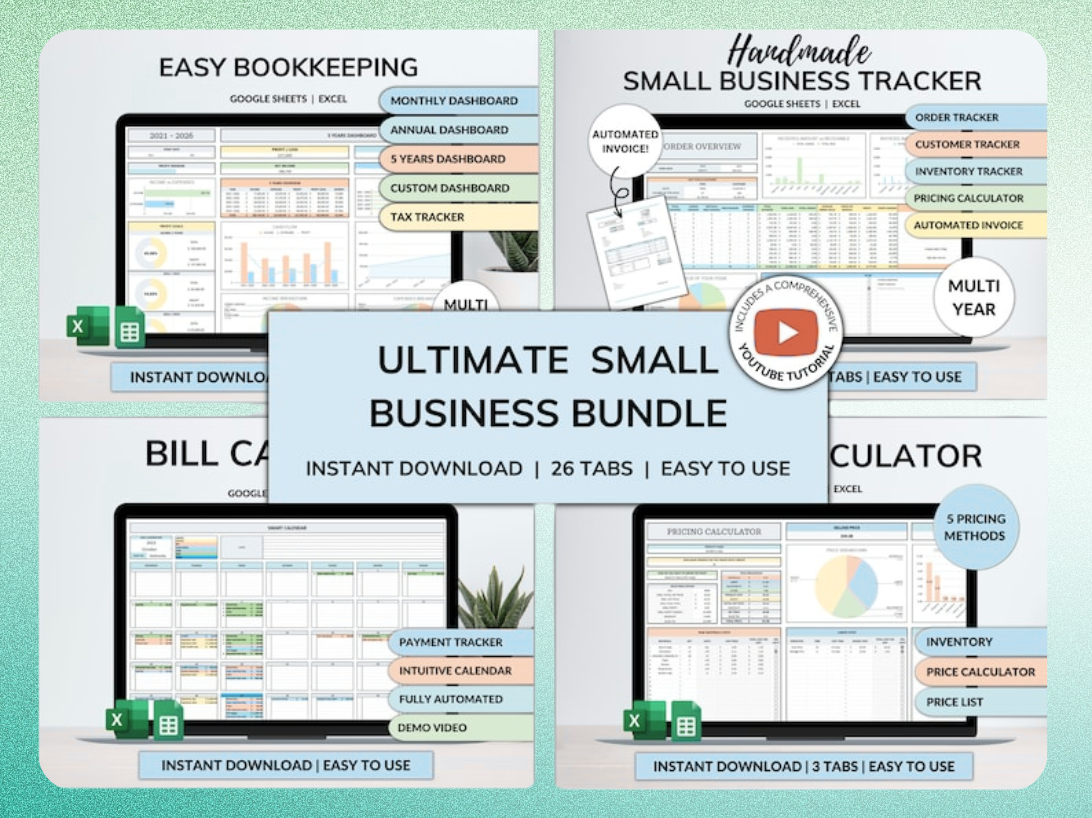
Skip the Blank-Sheet Setup
Start with the structure already built
The Ultimate Small Business Bundle includes ready-to-use templates for inventory tracking, order management, and supplier contact automation.
Add a Supplier Contact column and use =AI("Extract the supplier email address from this contact note", Contact Note Column) to standardize supplier information. Set up conditional formatting to highlight products in the Order Now status. Automate an email to your purchasing team every Monday with the list of products to reorder using Google Apps Script or Coefficient's alert feature.
This workflow prevents stockouts and reduces manual inventory checks. The AI demand prediction is only as good as your historical data, so verify the forecast against recent trends before placing large orders.
How to Automate Spreadsheets with AI: Formulas, Scripts, and Dashboards
Automation eliminates manual data entry, reduces formula errors, and keeps dashboards current without daily updates. The steps below show how to use AI for formula generation, data imports, and dashboard setup. Each section includes the tools you need and the mistakes to avoid.
Generating Formulas with Natural Language Prompts
Open the Gemini sidebar and type "write a formula to calculate the sum of column B where column A equals 'Closed Won'". Gemini returns =SUMIF(A:A, "Closed Won", B:B) with an explanation. Copy the formula into your sheet and verify it references the correct range. Use this approach for VLOOKUP, QUERY, ARRAYFORMULA, and conditional logic when you know what result you want but forget the syntax.
For complex formulas, break the prompt into steps. Instead of "create a formula that calculates weighted average deal size by sales rep and flags reps below target", ask Gemini to write the weighted average formula first, then add the conditional logic in a second prompt. This reduces errors and makes the formula easier to audit.
Common mistakes: accepting formulas without checking the range references, using AI-generated formulas in financial models without manual verification, and skipping comments that explain what the formula does. Always add a note in the adjacent cell or use named ranges to make the formula readable for future editors.
Automating Data Entry with AI-Powered Imports
Use Coefficient to connect your CRM, database, or business platform to Sheets, then set a refresh schedule. Data updates automatically every hour, day, or week without manual exports. Use Zapier to trigger data imports when a form is submitted, a deal closes, or an email arrives with a specific subject line. Use Google Apps Script to pull data from APIs that Coefficient doesn't support, then schedule the script to run on a timer.
For one-time imports, use the IMPORTDATA, IMPORTXML, or IMPORTHTML functions to pull data from public URLs. For recurring imports, set up a script or use an add-on to avoid hitting rate limits. Always validate the imported data against the source to catch formatting errors, missing rows, and API changes.
Common mistakes: importing sensitive data through third-party tools without checking their privacy policy, hitting API rate limits by refreshing too frequently, and skipping error handling so the import fails silently when the source changes.
Building AI-Enhanced Dashboards and Reports
Start with a data source that updates automatically via Coefficient, Zapier, or Apps Script. Create a summary sheet with calculated fields: total revenue, average deal size, conversion rate, and top performers. Use pivot tables to group data by category, time period, or sales rep. Add charts that visualize trends, comparisons, and outliers.
Use conditional formatting to highlight key metrics: green for above target, red for below target, yellow for at risk. Use =AI() or Gemini to generate insights: "summarize the top three trends in this revenue data" or "identify which product categories are growing fastest". Add a timestamp cell with =NOW() to show when the dashboard last updated.
Automate email delivery using Google Apps Script to send a PDF snapshot of the dashboard every Monday morning. Include a summary paragraph generated by Gemini that explains what changed since last week. This keeps stakeholders informed without requiring them to open the sheet.
Checklist for dashboard setup: verify data source updates automatically, confirm calculated fields reference the correct ranges, test conditional formatting with edge cases, add a last-updated timestamp, and schedule email delivery if stakeholders need regular reports.
When to Use a Pre-Built Template vs. Building from Scratch
Build from scratch when your workflow is unique, your data structure doesn't fit standard templates, or you need full control over every formula and chart. Use a pre-built template when you need a working system today and customization can happen later.
Templates save hours on bookkeeping, inventory management, order tracking, and billing when the structure is standard and the formulas are tested. The Ultimate Small Business Bundle Templates includes ready-to-use spreadsheets for all four areas, designed for small business owners, freelancers, and managers who need automation without custom development. The templates include calculated fields, conditional formatting, and dashboard views, so you can start tracking data immediately and adjust the structure as your business grows.
Use a template when speed and structure matter more than custom design. Build from scratch when the template doesn't fit your workflow or you need features the template doesn't include.
Common Mistakes When Using AI in Google Sheets
AI tools speed up spreadsheet work but introduce new failure modes. The mistakes below waste time, produce inaccurate results, and create compliance risks. Each section explains the problem and the fix.
Over-Relying on AI for Complex Financial Calculations
AI-generated formulas work well for simple aggregations, lookups, and text processing. They fail on complex financial calculations that require precision, audit trails, and compliance with accounting standards. Use AI to draft the formula, then verify every reference, operator, and logic branch manually. For tax calculations, depreciation schedules, and financial statements, write the formula yourself or use a tested template.
The risk is subtle errors that produce plausible results. An AI-generated IRR formula might reference the wrong cash flow range or use the wrong sign convention. The output looks reasonable until you compare it to a manual calculation or an external tool. Always cross-check financial formulas against a second source before using them in reports, filings, or decision-making.
Best practice: use AI for formula syntax help and range selection, then audit the output with sample data before applying it to the full dataset. For anything that affects financial reporting, tax filings, or legal compliance, have a second person review the formula.
Ignoring Data Privacy and API Limits
Third-party AI tools send your data to external servers for processing. If your sheet contains customer PII, financial records, or confidential business information, verify the tool's privacy policy and data retention practices before connecting it. Some tools store data for model training, some delete it after processing, and some don't disclose their practices clearly.
API limits hit when you run too many AI operations in a short time. The =AI() function throttles after a few hundred calls per hour. Numerous.ai charges per operation after the free tier. Coefficient limits the number of data refreshes per day on lower-tier plans. Plan your workflows to stay under these limits or upgrade to a paid plan if you need higher volume.
Best practice: anonymize sensitive data before using third-party AI tools, check rate limits before running bulk operations, and read the privacy policy to understand where your data goes and how long it's stored.
Skipping Formula Documentation and Version Control
AI-generated formulas are often complex, use nested functions, and reference ranges by letter-number notation instead of named ranges. This makes them hard to debug when they break and impossible to understand six months later when you need to modify them.
Add comments in adjacent cells that explain what the formula does, why you chose that approach, and what assumptions it makes. Use named ranges instead of cell references so the formula reads like =SUMIF(SalesData, "Closed Won", Revenue) instead of =SUMIF(A:A, "Closed Won", B:B). Track
Get the newsletter
One sharp idea every Sunday.
No fluff. No sales pitches. Just the best of what we publish, hand-picked.
Continue Reading
Related Articles

Excel vs Google Sheets 2026: 7 Key Differences & AI Features
Choosing between Excel and Google Sheets in 2026 isn't about picking the "better" tool. It's about matching the platform to your workflow, team size, and technical requirements. The gap between these...

20+ Free Excel Project Management Templates (2026)
Project management in 2026 demands efficiency and clear oversight. Free Excel templates offer a powerful, cost-effective solution for tracking tasks, managing budgets, and hitting deadlines. You can a...

2026 Excel Payroll Templates: Ultimate Guide & Free Downloads
Running payroll in Excel still works in 2026. Small business owners with 2-10 employees, HR teams managing seasonal workers, and freelancers paying contractors rely on payroll spreadsheet templates to...