Allocate projects smarter with this template
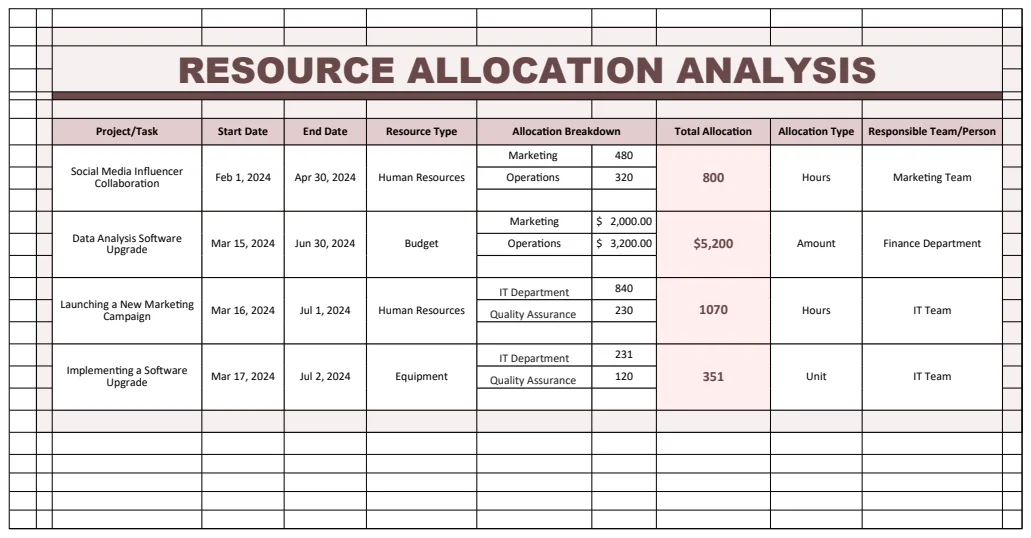
A resource allocation spreadsheet template helps you map resources to project demands and prevent bottlenecks before they occur.
The moment you realize a project is falling behind schedule is often when you discover resources are over-allocated or siloed. This happens because many early-stage plans simply list tasks, not the specific people or equipment needed, and don't account for overlapping demands. A well-structured resource allocation spreadsheet template is your first line of defense against this common pitfall. It forces you to think through not just what needs doing, but who is doing it and when they are available.
You need a system that clearly maps your available resources to project demands, highlighting potential bottlenecks before they occur. Without this clarity, you risk burnout for your team members, missed deadlines, and ultimately, project failure. This isn't about complex software; often, a detailed spreadsheet can provide the necessary visibility.
Identifying Your Resources
Before you can allocate anything, you need a clear inventory of what you have. This means listing every person, piece of equipment, or specialized skill that might be needed for your projects. Think broadly:
- Personnel: Developers, designers, project managers, QA testers, administrative staff, subject matter experts.
- Equipment: Servers, specialized machinery, testing devices, vehicles, meeting rooms.
- Software/Tools: Licenses for specific design software, cloud computing environments, testing platforms.
- Budget: Allocated funds for external contractors, software purchases, or travel.
For each resource, note its capacity. For a person, this might be hours per week. For equipment, it could be availability (e.g., 24/7, 8 hours/day). For software, it's typically the number of licenses.
Structuring Your Allocation Sheet
A robust resource allocation spreadsheet template will typically include several key sections. You can build this from scratch or adapt a pre-built solution.
At a minimum, you’ll want columns for:
- Project Name: The overall project this task belongs to.
- Task Name: A specific, actionable item within the project.
- Resource Name: The individual or asset assigned to the task.
- Resource Type: Categorize resources (e.g., "Developer," "Server," "Meeting Room"). This helps with aggregate analysis.
- Start Date: When the resource begins working on this task.
- End Date: When the resource is expected to complete this task.
- Duration (Days/Hours): The estimated time required for the task.
- Assigned Capacity (% or Hours): How much of the resource's total capacity is dedicated to this task. For example, 0.5 for half-time, or 20 hours.
This structure allows you to see, at a glance, who is working on what, for how long, and how much of their available time is consumed.
Calculating Resource Demand and Capacity
The core of effective resource allocation lies in comparing demand (what's needed for tasks) against capacity (what's available). Your spreadsheet should facilitate this comparison.
Demand Calculation: For each resource, sum up the "Assigned Capacity" across all tasks they are assigned to within a given period (e.g., a week or month).
Capacity Calculation: This is the total availability of a resource. If a full-time employee works 40 hours per week, their capacity is 40 hours.
The Comparison: Create a summary section or separate sheet that lists each resource and shows their total assigned demand versus their total available capacity for specific timeframes.
For instance, you might have a section that looks like this:
| Resource Name | Week of Jan 15 | Capacity | Demand | Variance (Capacity - Demand) | | :------------ | :------------- | :------- | :----- | :--------------------------- | | Alice Smith | 35 hours | 40 hours | 5 hours | Overallocated (7 hours) | | Bob Johnson | 20 hours | 40 hours | 20 hours | Available (20 hours) | | Dev Server 1 | 168 hours | 168 hours| 120 hours| Available (48 hours) |
If Alice Smith is assigned 35 hours of work in the week of Jan 15, but her total capacity is only 40 hours, she has 5 hours remaining. However, if across all her assigned tasks for that week, the sum of "Assigned Capacity" is 47 hours, she is overallocated by 7 hours. This is a critical red flag.
Using Formulas for Automation
To make your resource allocation spreadsheet template dynamic, leverage formulas.
- `SUMIFS`: This is invaluable for calculating demand. To find out how many hours Alice Smith is assigned in the week of Jan 15, you could use
SUMIFS(Assigned_Capacity_Column, Resource_Name_Column, "Alice Smith", Week_Column, "Jan 15"). You'd need helper columns to identify which week each task falls into. - `XLOOKUP` or `VLOOKUP`: To pull a resource's total capacity from a separate "Resource Master List" sheet into your main allocation sheet.
- Conditional Formatting: Set rules to automatically highlight cells where Demand exceeds Capacity, or where Variance is negative. Red for critical over-allocation, yellow for nearing capacity, green for ample availability.
Visualizing Resource Allocation
While raw numbers are essential, visualization turns data into actionable insights.
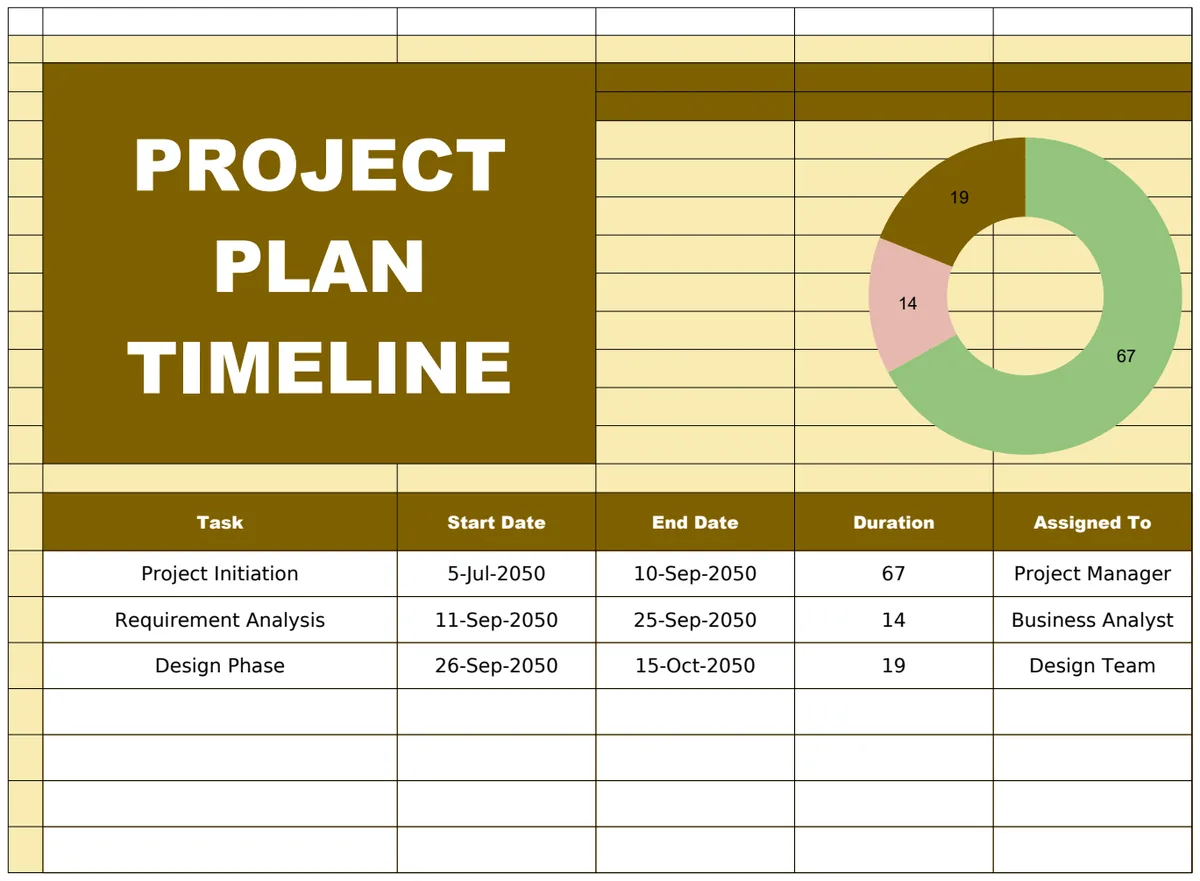
- Gantt Charts: A visual timeline is crucial. Tools like the Resource Gantt Template can map tasks against a calendar, showing when resources are busy and when they have gaps. This helps spot overlapping assignments visually.
- Stacked Bar Charts: For a high-level view, create charts showing the total capacity of each resource type (e.g., "Developers," "Designers") versus the total demand placed upon them over time. This quickly reveals which departments or skill sets are consistently strained.
- Heatmaps: Color-coding a calendar view where rows are resources and columns are days, with cell color indicating the percentage of capacity used, can be very effective for spotting busy periods at a glance.
Common Mistakes to Avoid
Many teams stumble in resource allocation due to recurring errors. Be mindful of these:
- Over-optimism: Assuming resources will always be 100% available and billable. Realistically, account for meetings, training, administrative tasks, and unexpected interruptions. A common approach is to assume 80-90% capacity for core project work.
- Ignoring Non-Project Time: Failing to track time spent on internal meetings, bug fixing that isn't directly tied to a project, or administrative overhead. This leads to an inaccurate picture of actual project contribution.
- Lack of Centralized Data: Using multiple disconnected spreadsheets or relying on verbal assignments. This makes it impossible to get an accurate, consolidated view of resource utilization.
- Not Reviewing and Adjusting: Resource allocation isn't a one-time setup. It requires regular review (weekly or bi-weekly) to reassign tasks, adjust timelines, and address emerging conflicts. A solution like the Resource Management Template can help integrate these reviews.
- Forgetting Indirect Resources: Not accounting for shared equipment, meeting rooms, or specialized software licenses, which can become bottlenecks even if personnel are available.
Advanced Considerations and Next Steps
What if a resource is consistently over-allocated?
If your analysis shows a resource is perpetually booked beyond their capacity, you have a few options. First, review all their assigned tasks, can any be deferred, delegated to someone else, or broken down further to reduce the immediate load? Second, consider if external help is needed, such as hiring a freelancer or contractor, or investing in automation tools. Finally, re-evaluate project priorities; perhaps some projects need to be de-scoped or pushed to a later quarter. The Resource Allocation Analysis Template can help you identify these patterns early.
How do I track resource allocation for multiple projects simultaneously?
The key is a unified system. Your spreadsheet should have a field for "Project Name" for every task. When using formulas like SUMIFS, you can add the project name as an additional criterion to filter demand by project. For example, you could calculate the total hours "Alice Smith" is assigned to "Project Phoenix" in a given week. This allows you to see not just her overall load, but also how her time is distributed across different initiatives.
Can a simple spreadsheet truly handle complex resource needs?
For many organizations, especially smaller ones or those managing a limited number of projects, a well-designed spreadsheet is perfectly adequate. It offers flexibility and is easy to understand. However, as projects multiply, team sizes grow, and resource interdependencies become more intricate, you might eventually outgrow a spreadsheet. At that point, dedicated resource management software can offer more sophisticated features like advanced scheduling algorithms, real-time collaboration, and automated reporting, but the fundamental principles learned from building your own resource allocation spreadsheet template remain the same. The initial investment of $9 for unlimited downloads from our library might offer a faster path to a robust solution if you're looking to skip the build phase.