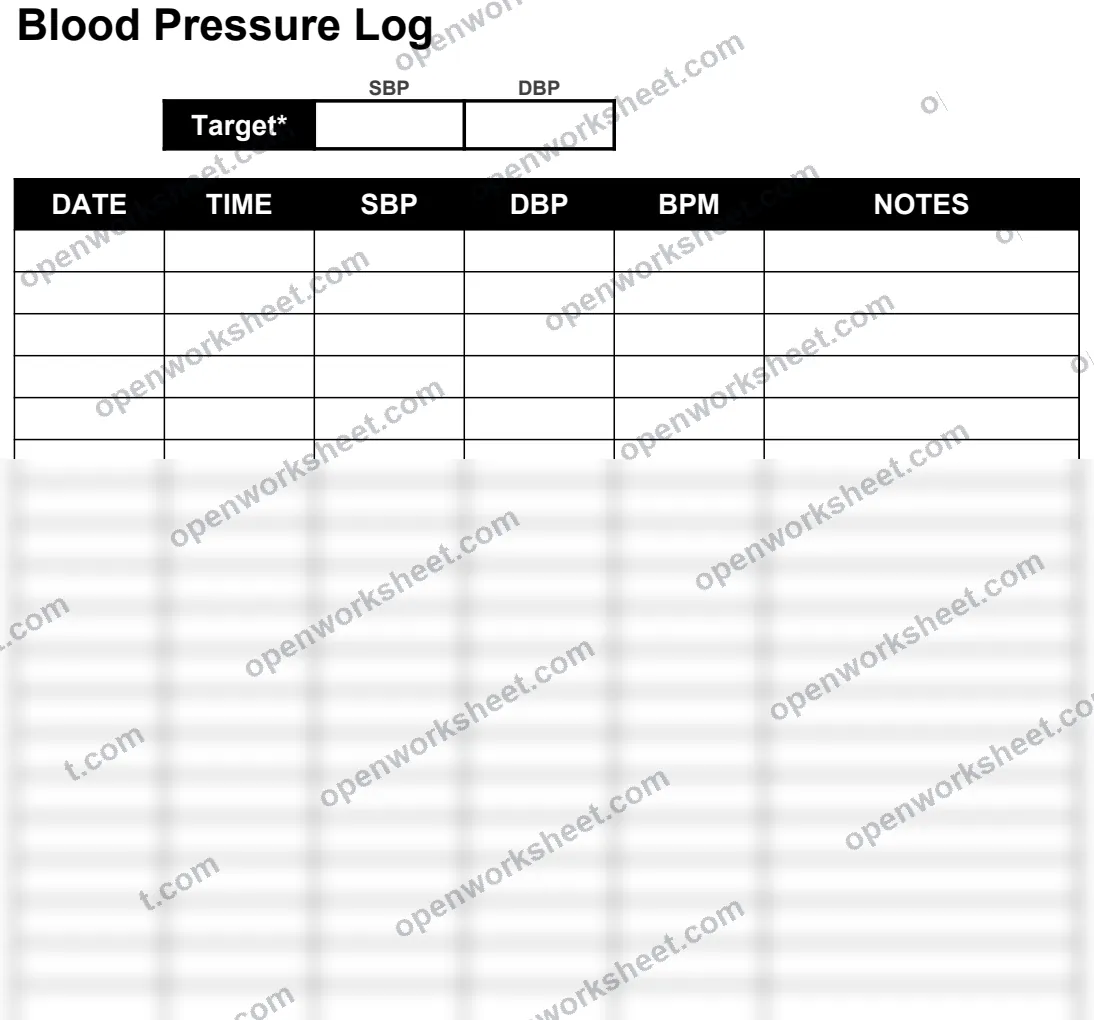
Blood Pressure Log
Track systolic and diastolic readings daily to monitor heart health and medication effectiveness.
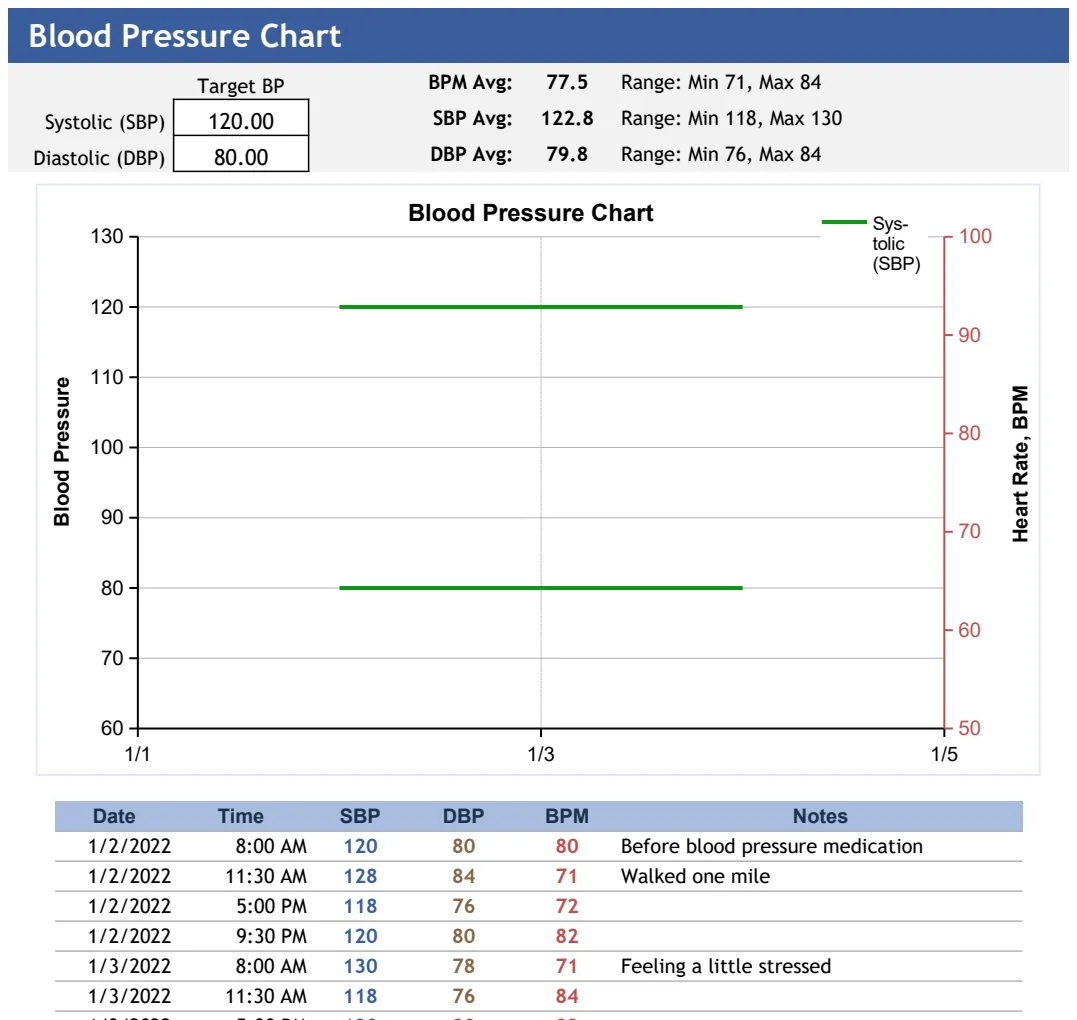
This blood pressure log lets you record systolic (SBP) and diastolic (DBP) readings with target thresholds, helping you identify patterns and trends in your cardiovascular health. Regular monitoring is essential for managing hypertension, validating medication adjustments, and catching potential health issues early. Perfect for patients with high blood pressure, those adjusting medications, or anyone following medical guidance for preventive health.
What's inside
- Systolic and diastolic reading columns
- Target threshold comparison
- Daily entry structure
- Large format for easy readability
- Pattern identification over time
Download this and everything else
.xlsx · 1 sheet
$29$9once for thousands of templates. No subscription.
- Limited-time offer, normally $29
- One payment, no subscription
- 14-day refund
More in Health & Wellness
 Health & Wellness
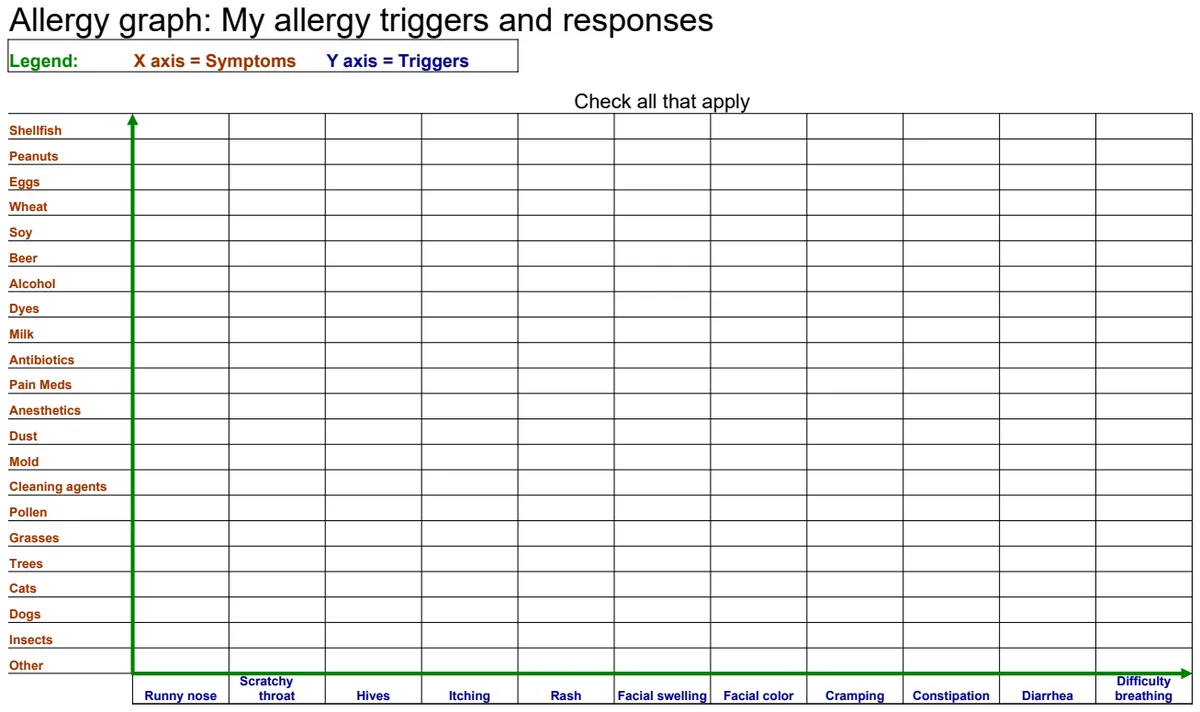
Allergy Trigger & Response Graph
Map your allergy triggers against symptoms to identify patterns and manage reactions effectively.
- Trigger-symptom cross-reference grid
- Visual pattern identification
- Customizable trigger and symptom categories
 Health & Wellness
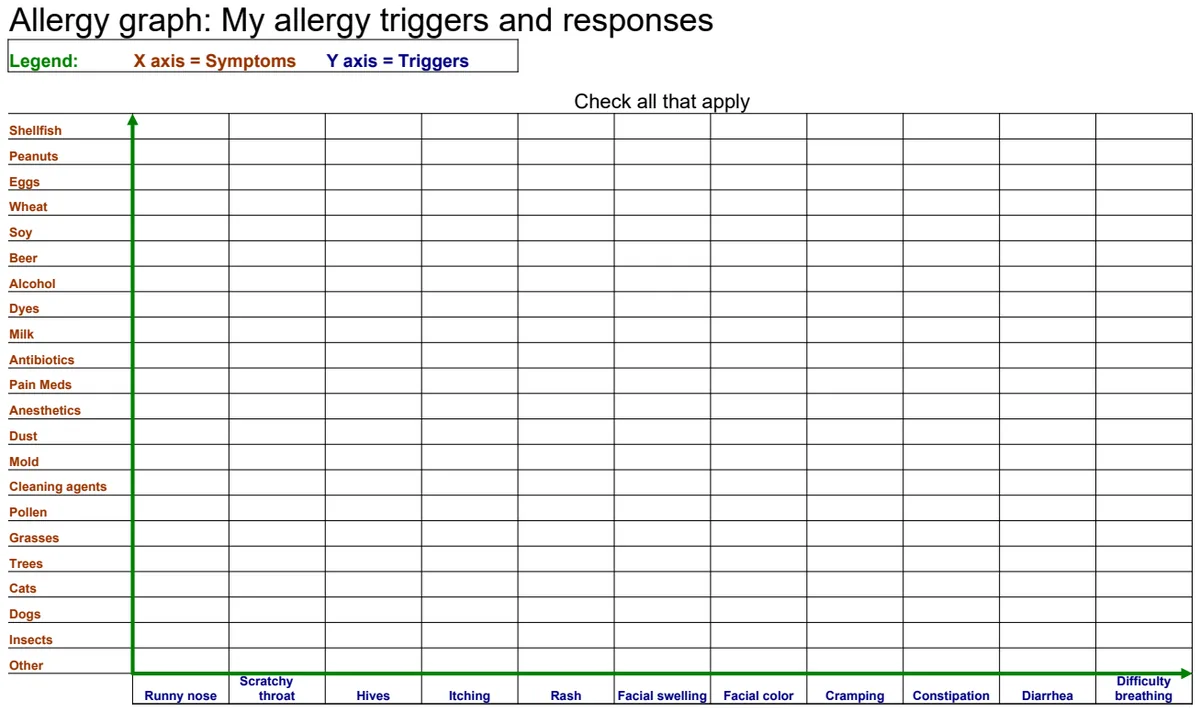
Allergy Triggers and Responses Chart
Track and visualize your allergy triggers against symptoms in an easy-to-read grid format.
- Trigger vs. symptom grid with checkboxes
- Visual cross-reference chart
- Legend for easy interpretation
 Health & Wellness
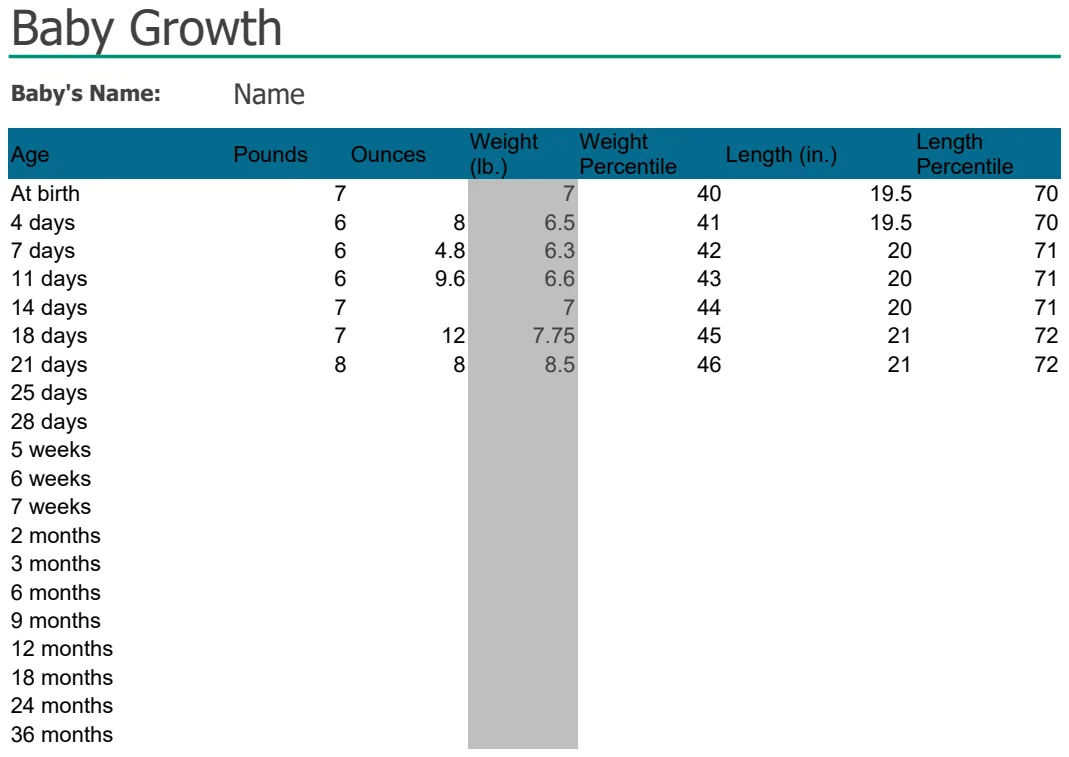
Baby Growth Chart Tracker
Monitor your baby's weight and growth percentiles over time with visual charts and tracking data.
- Weight entry in pounds and ounces
- Automatic weight calculation
- Growth percentile tracking
 Health & Wellness
Blood Pressure Chart
Track and visualize daily blood pressure readings with automated averaging and trend analysis.
- Automatic calculation of systolic and diastolic averages
- Visual chart displaying BP readings over time
- Date-based logging with BPM tracking