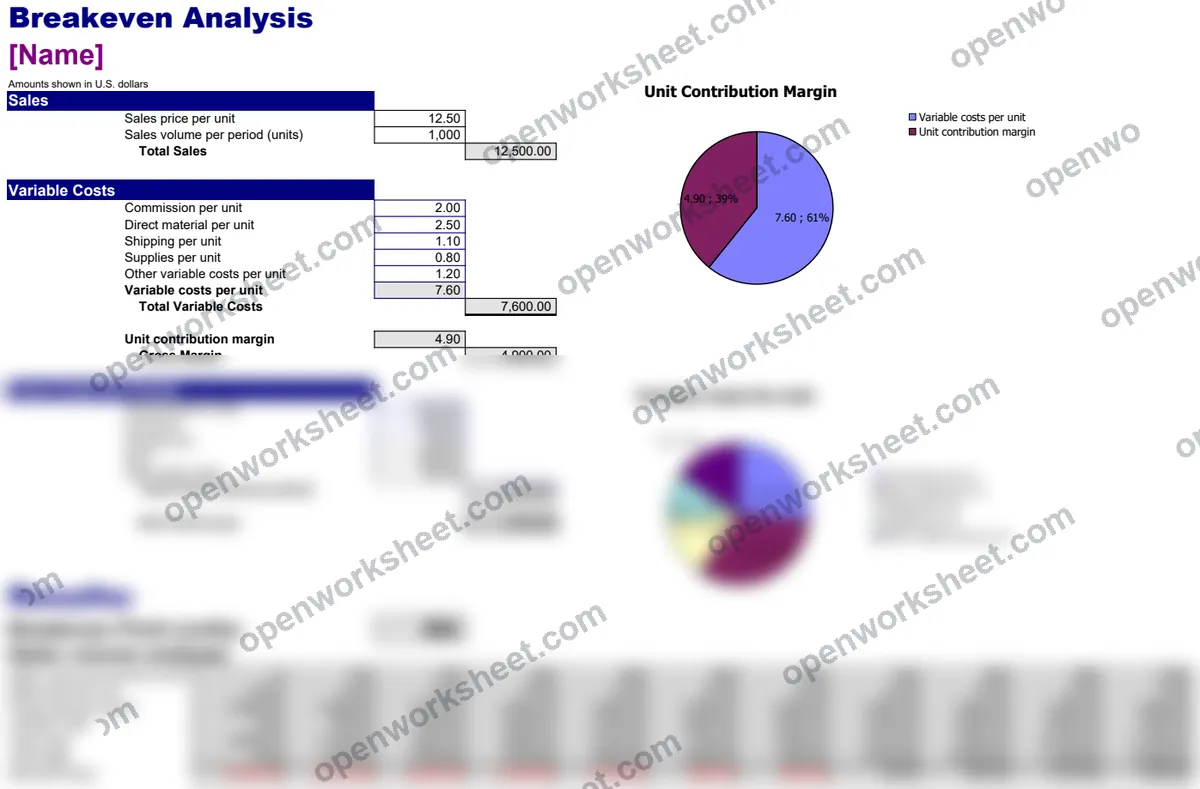
Breakeven Analysis Template
Calculate your breakeven point and visualize when your business becomes profitable.
This template helps you determine exactly how many units you need to sell or revenue you need to generate to cover your costs. It includes data input sections, automatic calculations for fixed costs, variable costs, and profit margins, plus a chart that visualizes your breakeven point. Perfect for business owners, entrepreneurs, and finance professionals evaluating product profitability or pricing strategies.
What's inside
- Automatic breakeven point calculation
- Cost and revenue visualization chart
- Fixed and variable cost inputs
- Profit margin analysis
- Unit and revenue-based breakeven metrics
Download this and everything else
.xlsx · 3 sheets · includes charts
$29$9once for thousands of templates. No subscription.
- Limited-time offer, normally $29
- One payment, no subscription
- 14-day refund
More in Business Planning & Strategy
 Business Planning & Strategy
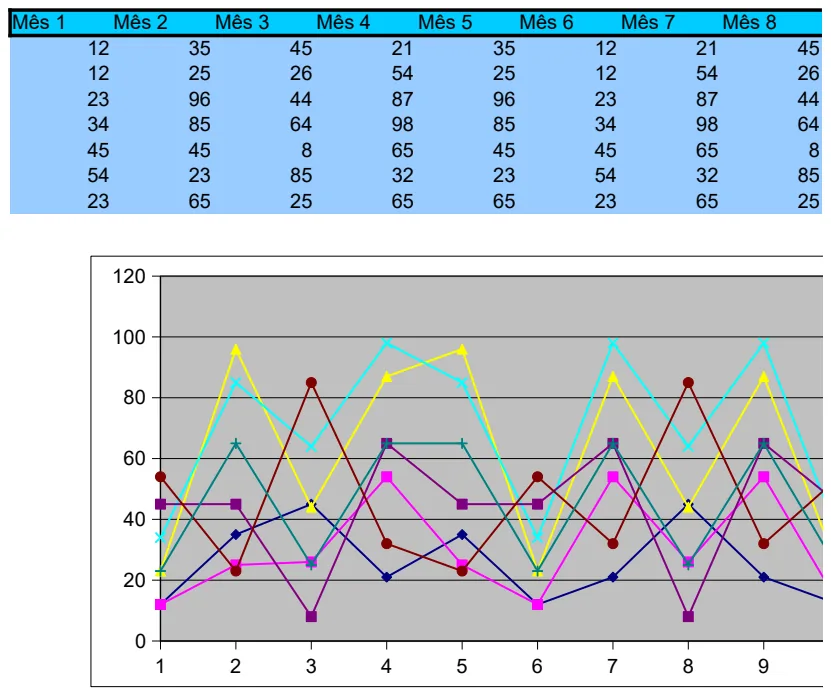
12-Month Business Performance Tracker
Track and visualize monthly performance metrics across a full year with built-in charts.
- 12-month column structure (Mês 1-12)
- Pre-built sample data for immediate visualization
- Integrated charts for trend analysis
 Business Planning & Strategy
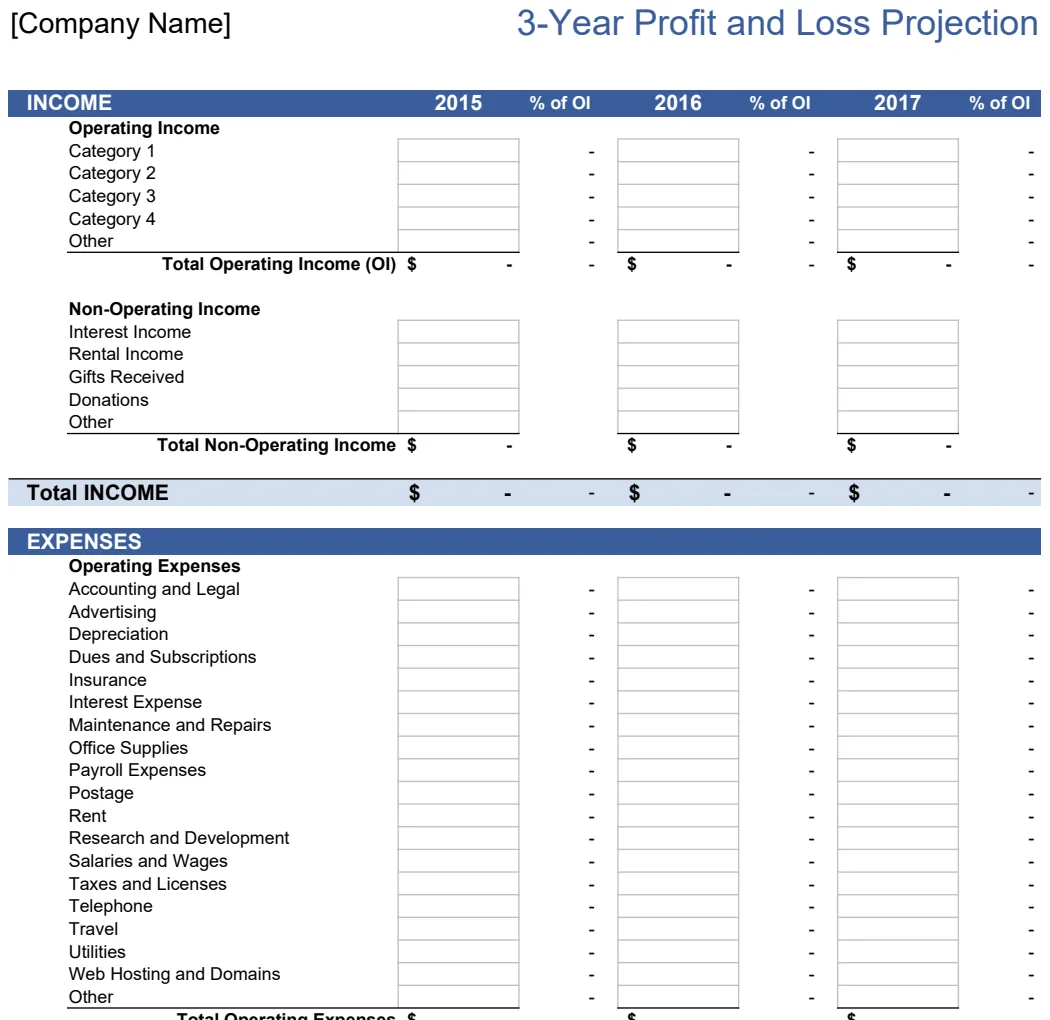
3-Year Profit and Loss Projection
Project revenue, expenses, and net profit across three years for services or goods businesses.
- Separate projections for service and product-based revenue models
- Annual profit margin analysis as percentage of operating income or sales
- Automatic calculations for total expenses and net profit
 Business Planning & Strategy
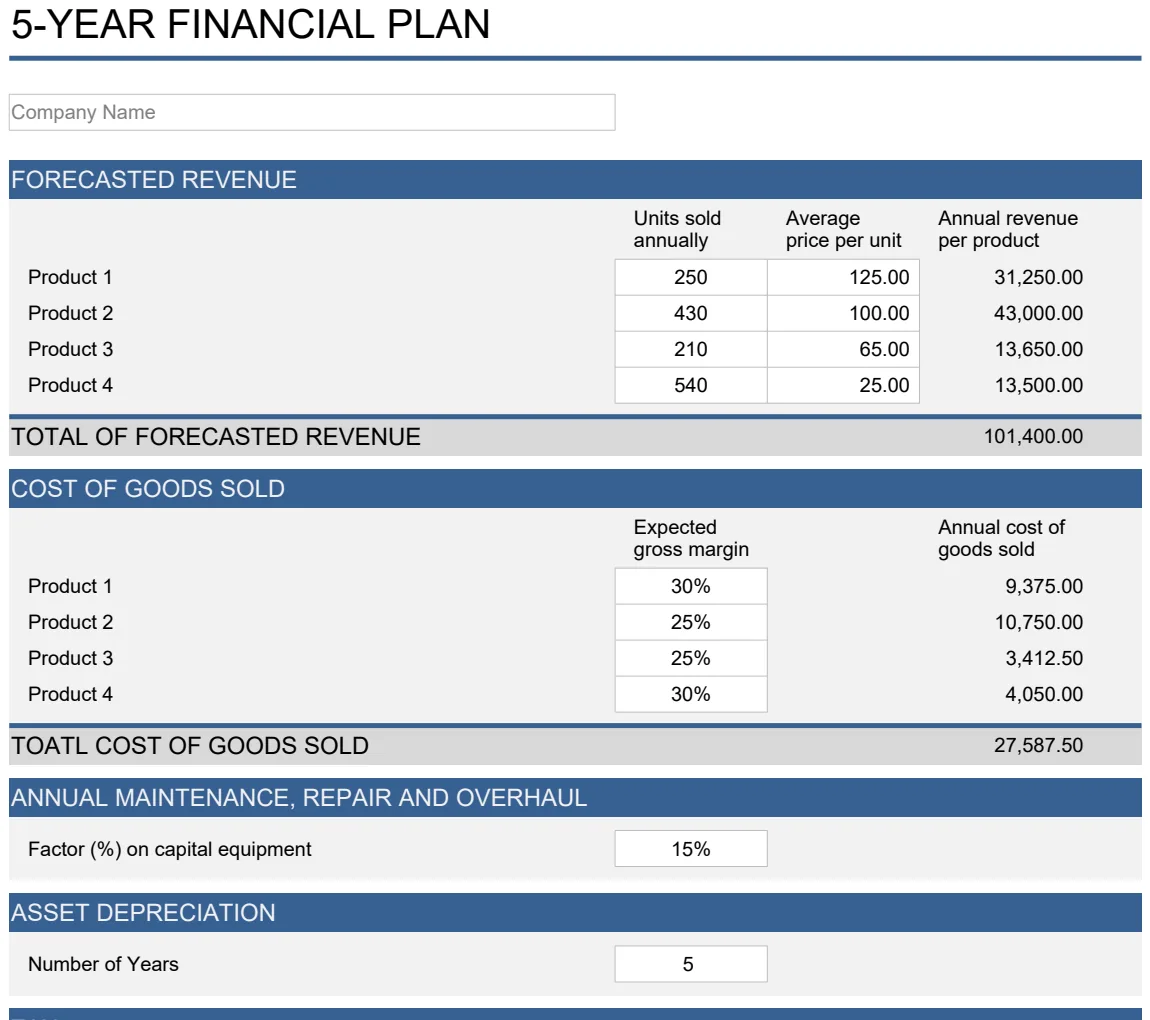
5 Year Financial Plan
Project revenue, expenses, and cash flow across 5 years with P&L, balance sheet, and loan amortization.
- 5-year revenue and expense forecasting
- Profit and loss projection with assumptions
- Balance sheet projection with asset tracking
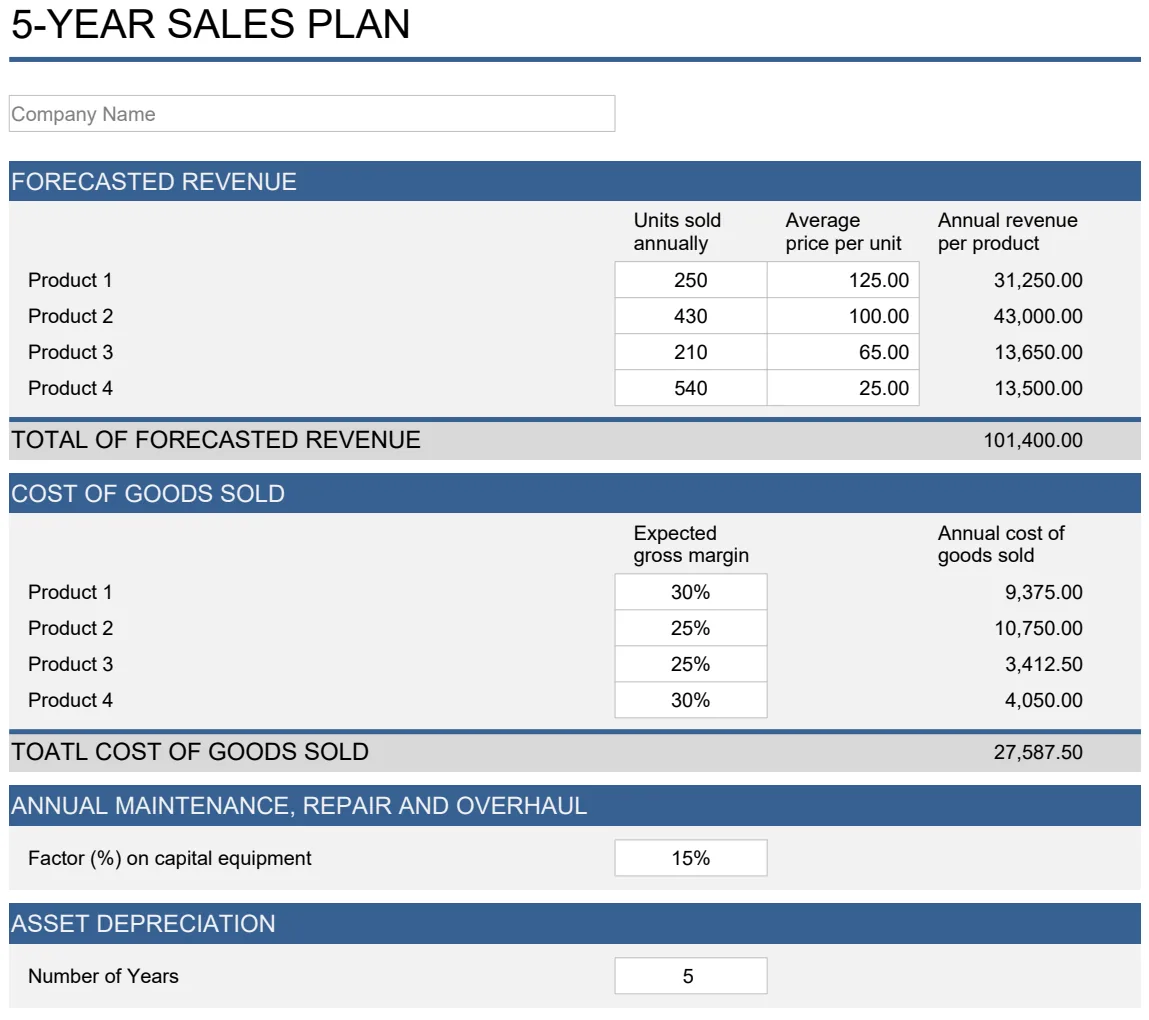 Business Planning & Strategy
5 Year Projected Financial Statements
Complete financial projections with P&L, balance sheet, cash flow, and loan amortization for 5-year business planning.
- 5-year sales and revenue forecasting
- Automated P&L projection calculations
- Balance sheet projections with asset tracking