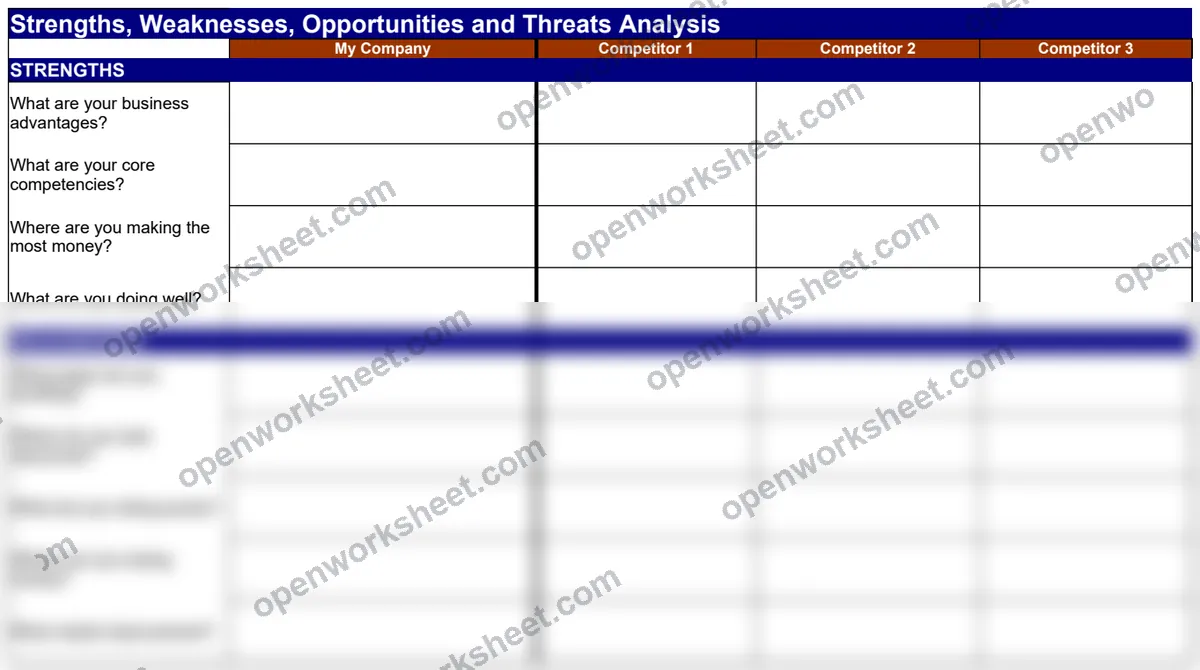
Competitive Analysis using SWOT
Compare your company against competitors with side-by-side SWOT and financial metrics analysis.
Track strengths, weaknesses, opportunities, and threats across your company and up to three competitors in one visual framework. The template includes detailed financial metrics like revenue, net income, assets, and liabilities, helping you identify competitive advantages and market gaps. Use this to inform strategic decisions, spot where competitors excel, and uncover opportunities to differentiate your business.
What's inside
- Side-by-side SWOT comparison grid
- Financial metrics dashboard including revenue and profitability
- Web presence and employee count tracking
- Automated competitor data organization
- Visual strength/weakness assessment
Download this and everything else
.xlsx · 2 sheets
$29$9once for thousands of templates. No subscription.
- Limited-time offer, normally $29
- One payment, no subscription
- 14-day refund
More in Business Planning & Strategy
 Business Planning & Strategy
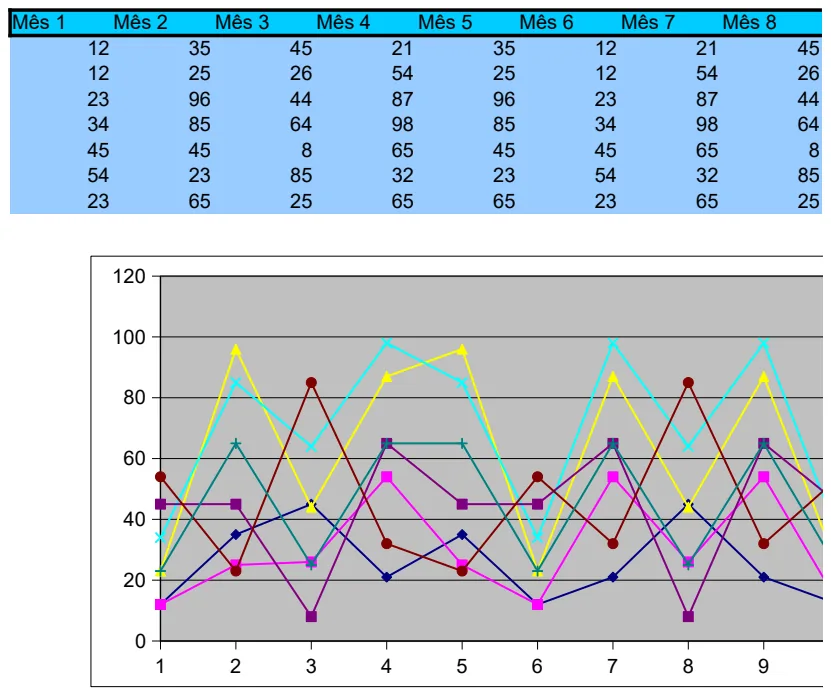
12-Month Business Performance Tracker
Track and visualize monthly performance metrics across a full year with built-in charts.
- 12-month column structure (Mês 1-12)
- Pre-built sample data for immediate visualization
- Integrated charts for trend analysis
 Business Planning & Strategy
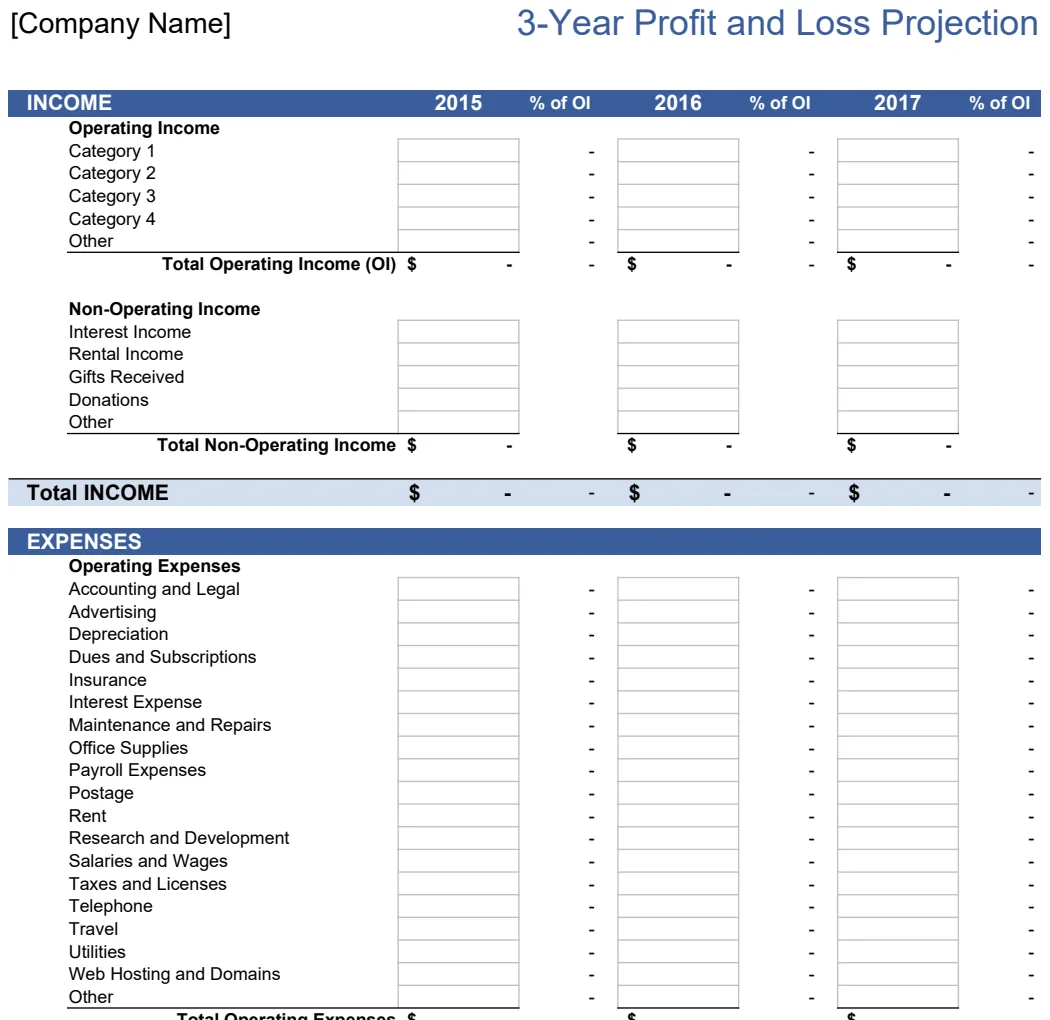
3-Year Profit and Loss Projection
Project revenue, expenses, and net profit across three years for services or goods businesses.
- Separate projections for service and product-based revenue models
- Annual profit margin analysis as percentage of operating income or sales
- Automatic calculations for total expenses and net profit
 Business Planning & Strategy
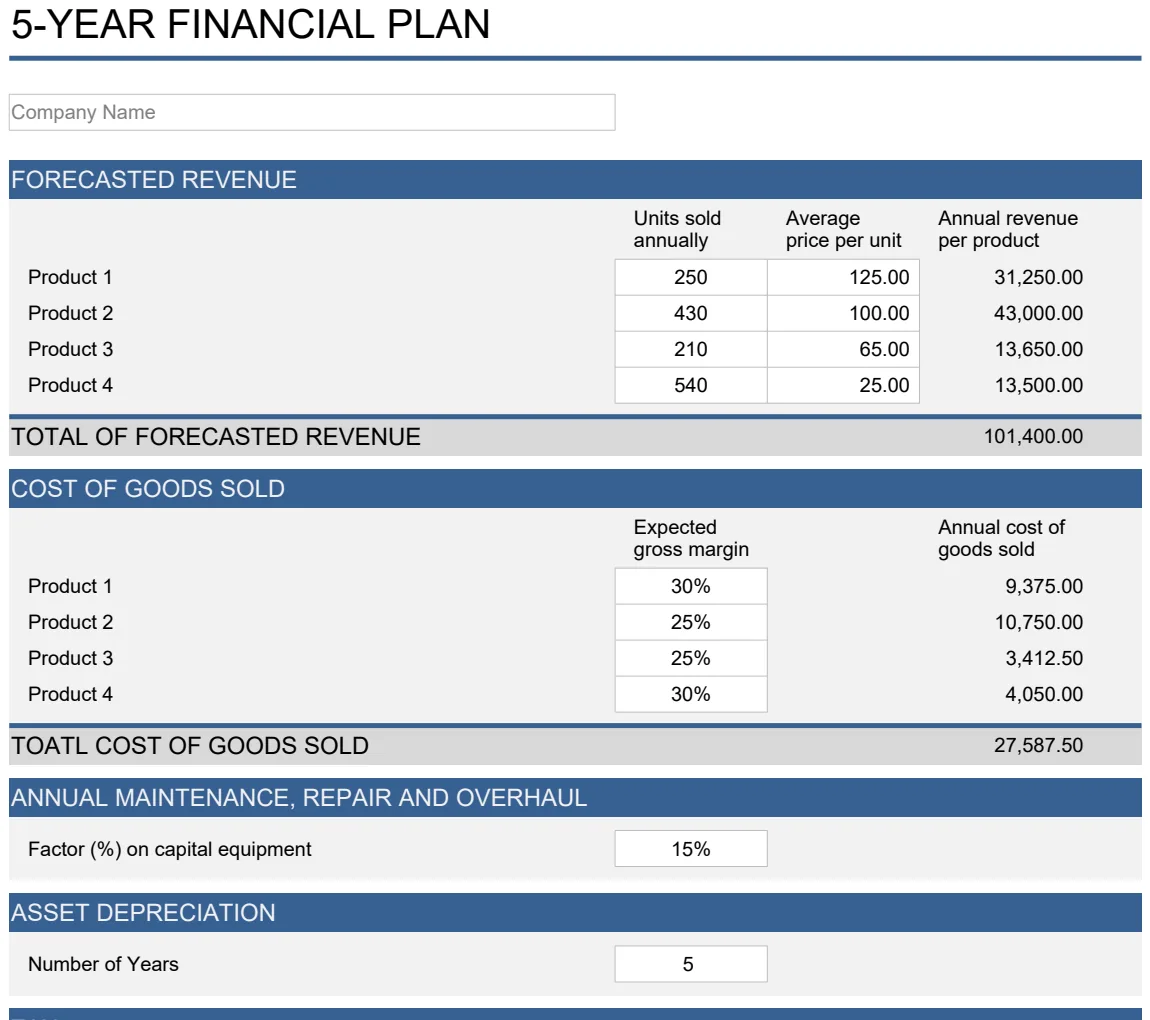
5 Year Financial Plan
Project revenue, expenses, and cash flow across 5 years with P&L, balance sheet, and loan amortization.
- 5-year revenue and expense forecasting
- Profit and loss projection with assumptions
- Balance sheet projection with asset tracking
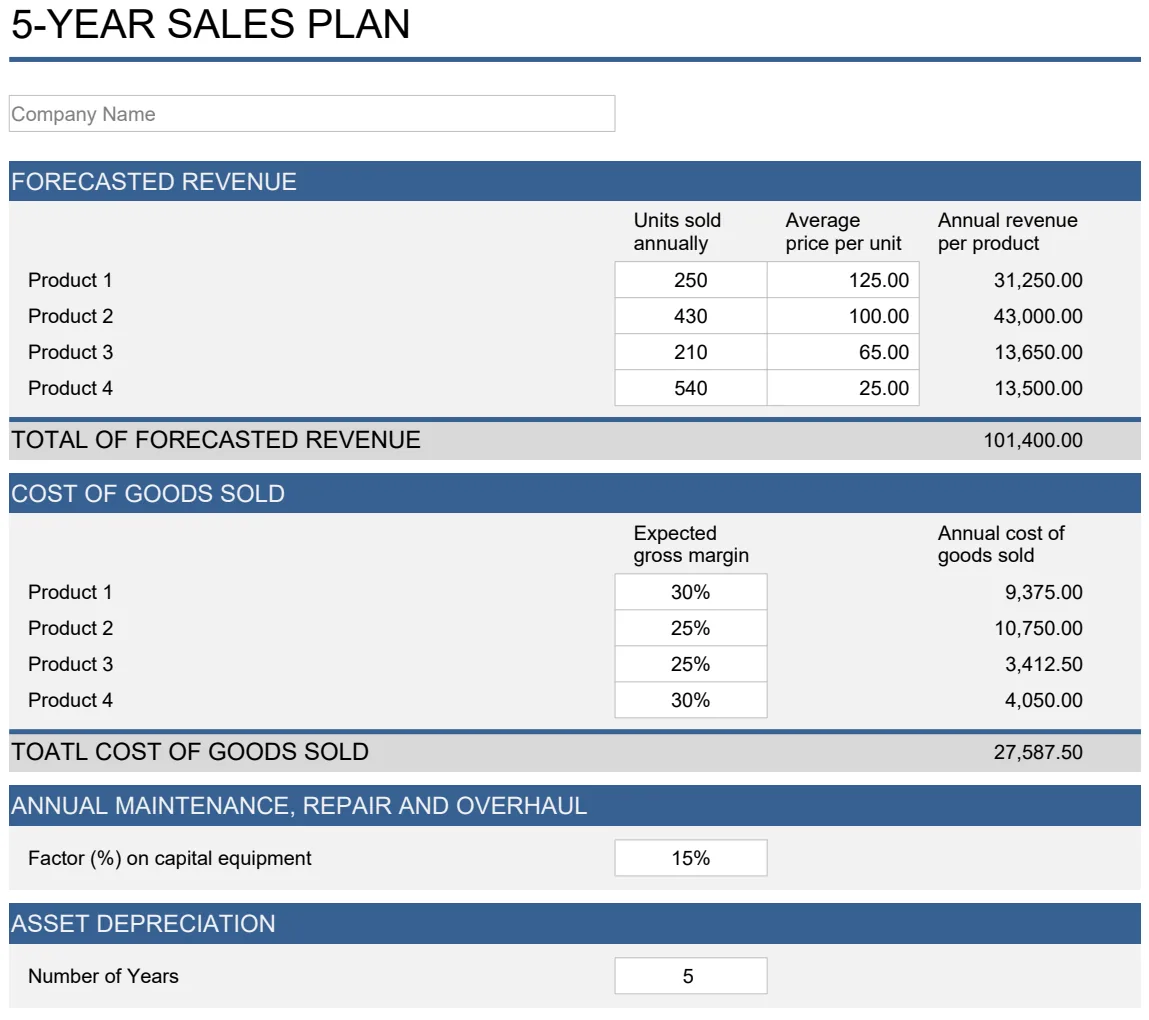 Business Planning & Strategy
5 Year Projected Financial Statements
Complete financial projections with P&L, balance sheet, cash flow, and loan amortization for 5-year business planning.
- 5-year sales and revenue forecasting
- Automated P&L projection calculations
- Balance sheet projections with asset tracking