
CRM & Sales KPI System
A complete CRM and sales dashboard in Excel. Deals, accounts, contacts, activities and quotas roll up into live KPIs, a leaderboard and a monthly forecast.
CRM & Sales KPI System gives a small sales team a working CRM in one Excel workbook. Log deals, accounts, contacts and activities, set monthly quotas, and the dashboard keeps score: open pipeline and weighted forecast, revenue won this year and this month against quota, win rate, average deal size, sales cycle, new deals, activities and the number of deals that need attention. It also shows pipeline by stage with funnel bars, a top-5 leaderboard, the top 8 open deals, revenue against quota by month and your activity mix.
Every deal gets a probability from its stage, with an optional override per deal, plus weighted value, age, sales cycle, last and next activity and days idle. A health flag marks each one as Healthy, Past due, Stale, At risk or No next step, so slipping deals stand out before they are lost, and duplicate deal names are flagged.
Accounts show open pipeline, won revenue, last activity and engagement (Hot, Warm or Cold). Contacts track the last touch and next follow-up, with Overdue and Schedule one flags. Activities cover calls, emails and meetings, and a planned task shows as Upcoming, Due today or Overdue.
Targets holds monthly quotas per rep and fills in won revenue and an attainment heatmap on its own. The Team tab ranks reps by attainment, with quota to date, won revenue, win rate, average deal, cycle time, pipeline, activities and overdue tasks. Forecast compares won plus weighted pipeline with quota by month and breaks results down by stage, lead source, product and lost reason.
Stage probabilities, the rules for when a deal counts as stale or closing soon, a team of up to 15 reps and every dropdown list live on the Settings tab. Over 26,000 formulas sit in locked cells, so a stray keystroke cannot break a calculation, and protection has no password, so you can unprotect any tab to customise it. Sample data from an example company is included so you can see every tab working before you add your own. Built for Microsoft Excel (desktop or Excel for the web) and contains no macros.
What's inside
- 10 connected tabs, from a quick-start guide to Settings
- Sales dashboard with 10 KPIs and charts
- Pipeline by stage with funnel bars
- Deal probability from stage, with per-deal override
- Weighted value, age, cycle and days idle per deal
- Deal health: Healthy, Past due, Stale, At risk, No next step
- Duplicate deal name check
- Account engagement: Hot, Warm or Cold
- Contact follow-ups with overdue flags
- Activity log with Upcoming, Due today and Overdue
- Monthly quotas per rep with attainment heatmap
- Team leaderboard for up to 15 reps
- Forecast by month, lead source, product and lost reason
- Over 26,000 locked formulas, no macros
Download this template
.xlsx · 10 sheets · includes charts
$9/monthDownload up to 10 templates a month from a library of thousands. Cancel anytime.
- 10 downloads every month
- Cancel anytime
- 14-day refund policy
More in Sales & CRM
 Sales & CRM
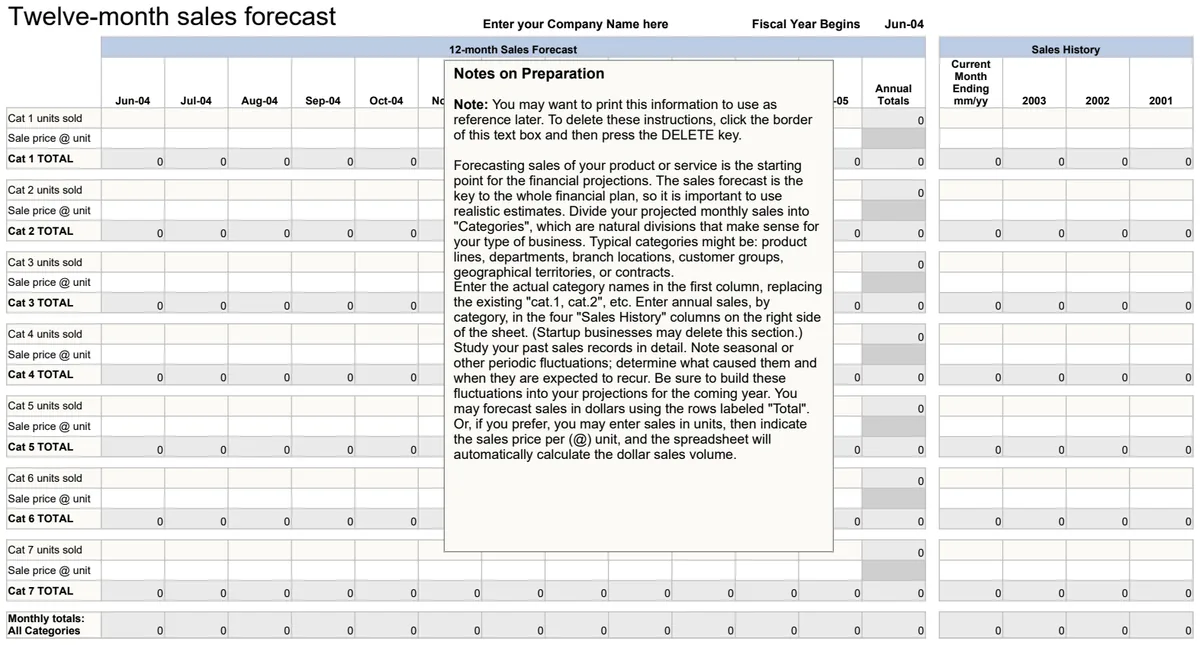
12 Month Sales Forecast
Project monthly revenue for the next 12 months with automated date calculations and totals.
- Automated month-by-month date generation
- Monthly sales amount entry fields
- Running total calculations across the year
 Sales & CRM
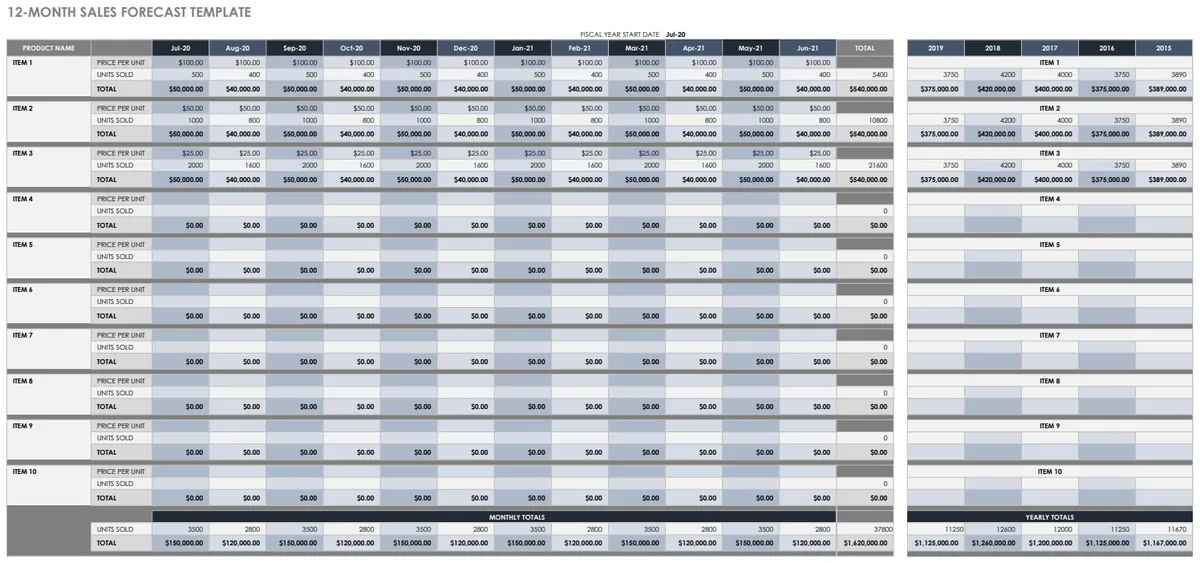
12 Month Sales Forecast Multiple Projects
Project-based sales forecasting across 12 months with pricing and unit tracking.
- 12-month rolling forecast view
- Multiple product/project lines
- Unit price and quantity tracking
 Sales & CRM
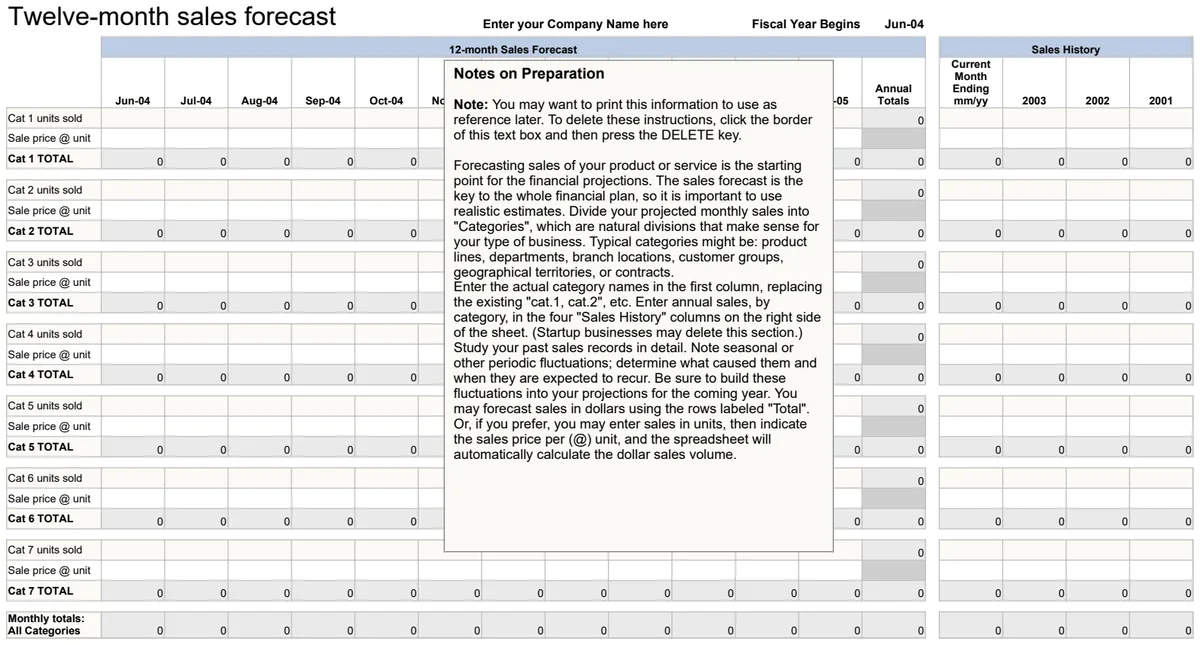
12-Month Sales Forecast
Project monthly revenue with automatic date calculations and rolling totals for annual planning.
- Automatic month-by-month date progression
- Summary totals for quarterly and annual sales
- Company name and fiscal year customization
 Sales & CRM
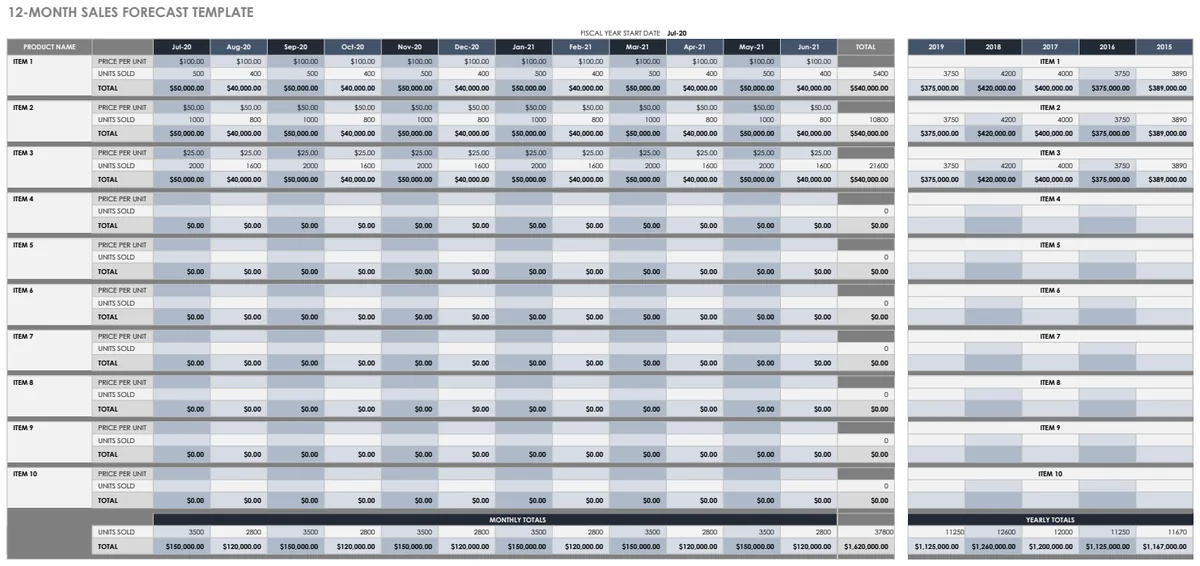
12-Month Sales Forecast Template
Project monthly revenue by product to plan inventory, staffing, and cash flow confidently.
- 12-month sales projection grid by product
- Automatic date calculation for each month
- Unit price and quantity tracking