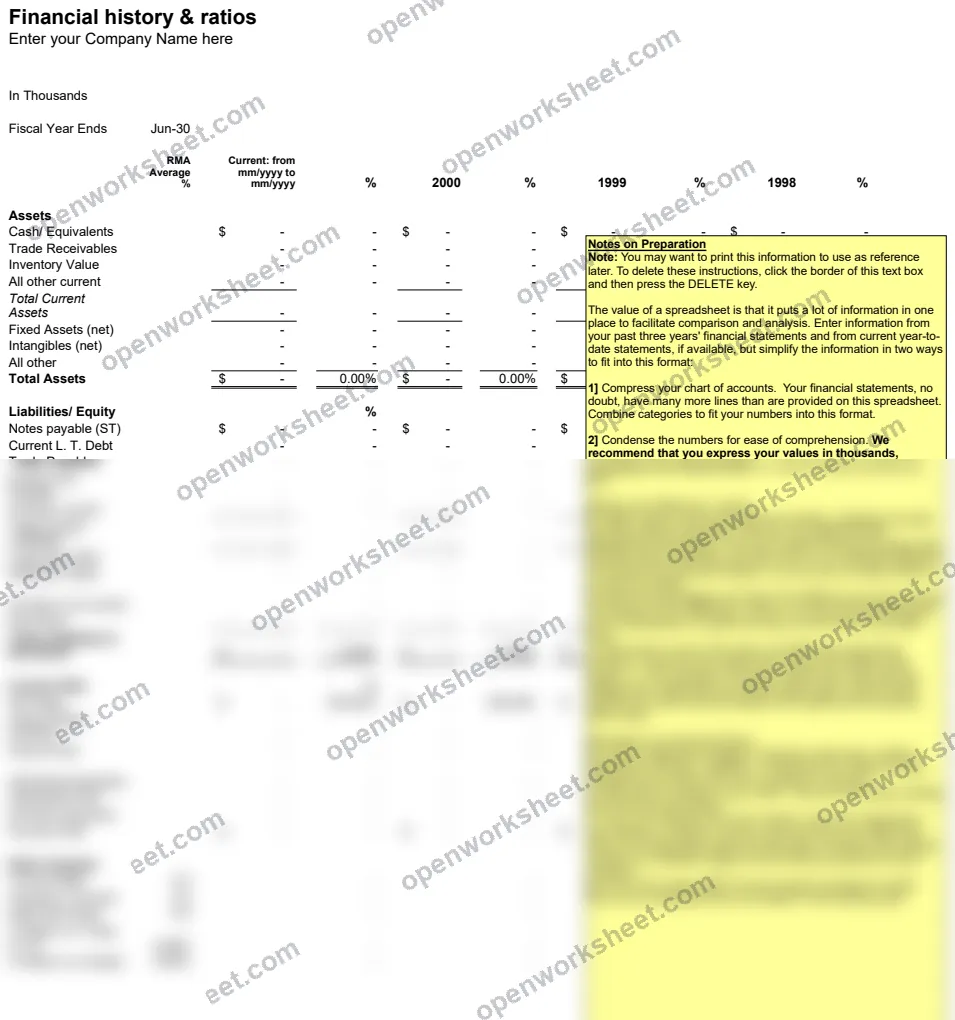
Financial History & Ratios
Track company financial performance over time with calculated ratios and year-over-year analysis.
This template captures your company's financial history and automatically calculates key financial ratios to monitor performance trends. It helps you visualize profitability, efficiency, and financial health metrics across multiple periods. Use it to present financial performance to stakeholders, identify trends, and make data-driven business decisions.
What's inside
- Automatic ratio calculations using formulas
- Multi-year financial data comparison
- Year-based filtering and sorting
- Pre-built summary metrics
- Company information header
Download this and everything else
.xlsx · 1 sheet
$29$9once for thousands of templates. No subscription.
- Limited-time offer, normally $29
- One payment, no subscription
- 14-day refund
More in Accounting & Bookkeeping
 Accounting & Bookkeeping
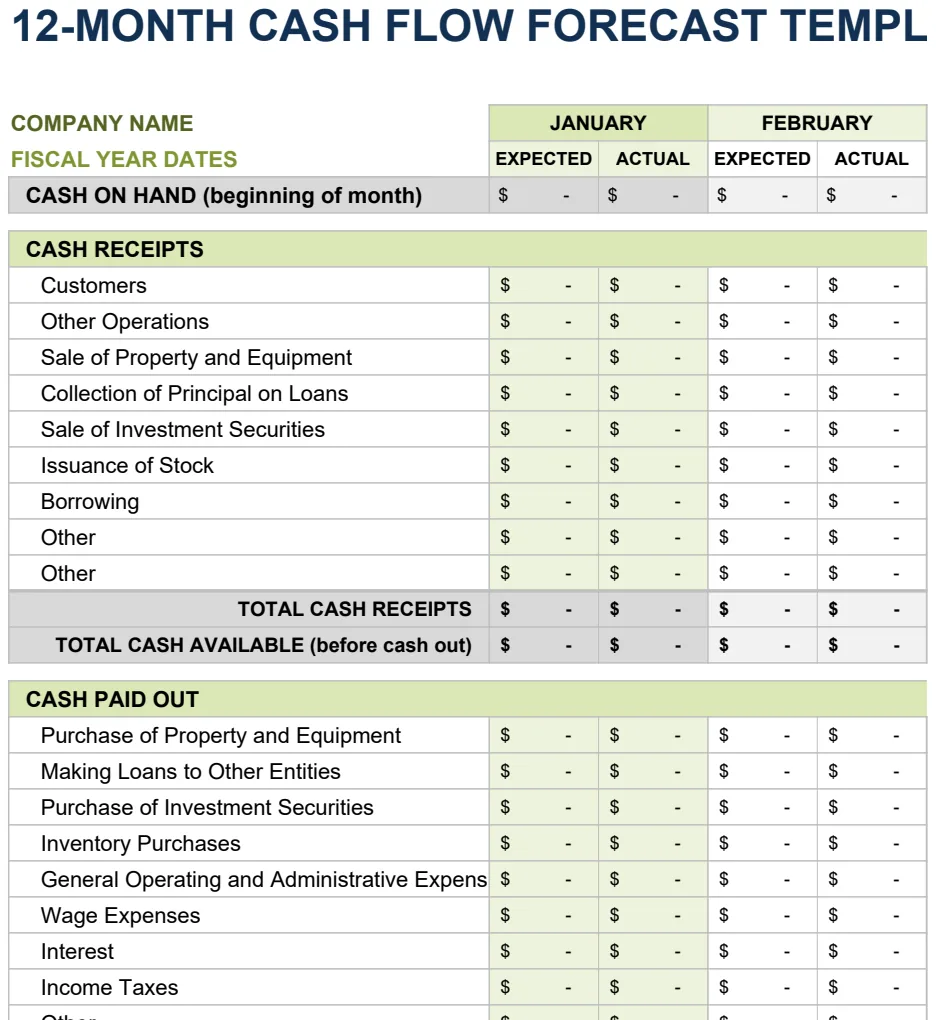
12 Month Cash Flow Forecast
Project monthly cash inflows and outflows to manage liquidity and plan for operating expenses.
- 12-month rolling forecast with expected vs. actual columns
- Month-by-month cash inflow and outflow tracking
- Automatic SUM calculations for cash position
 Accounting & Bookkeeping
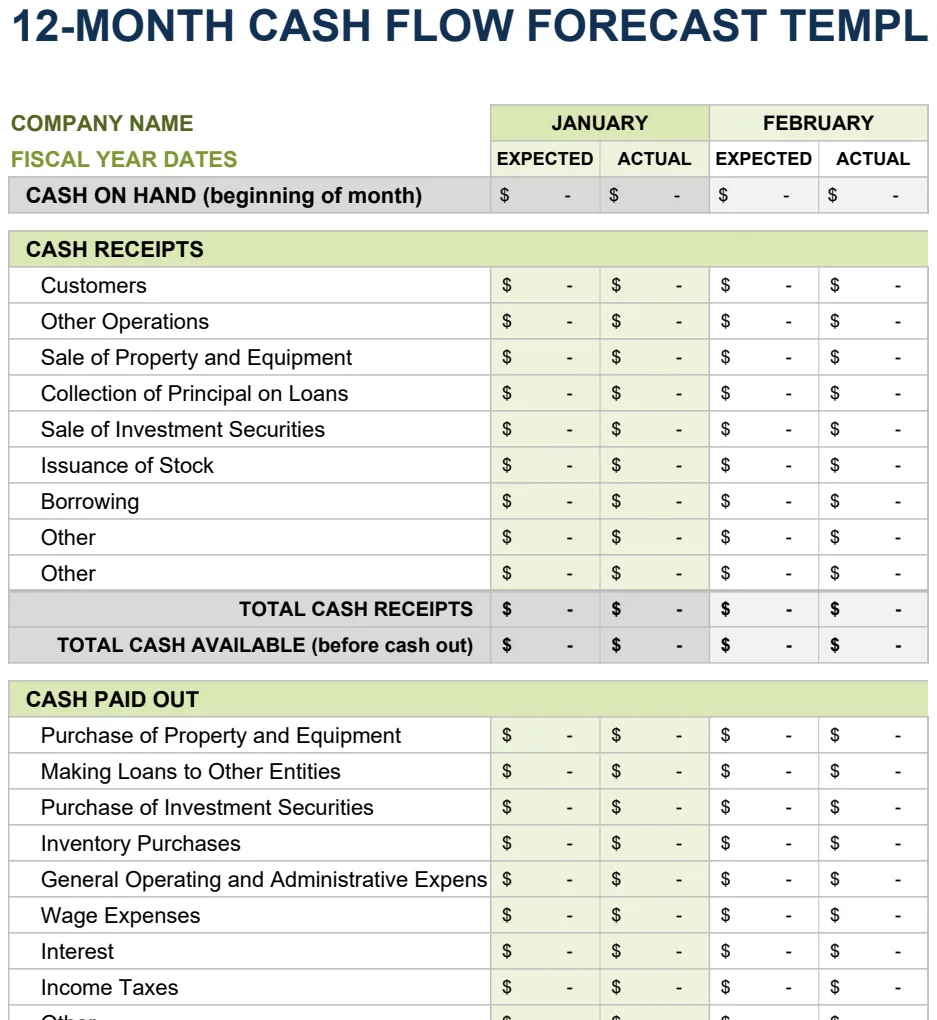
12 Month Cash Flow Forecast
Project monthly cash inflows and outflows to manage liquidity and financial planning.
- 12-month rolling projection with expected vs actual columns
- Monthly period comparison structure
- Automated SUM formulas for period totals
 Accounting & Bookkeeping
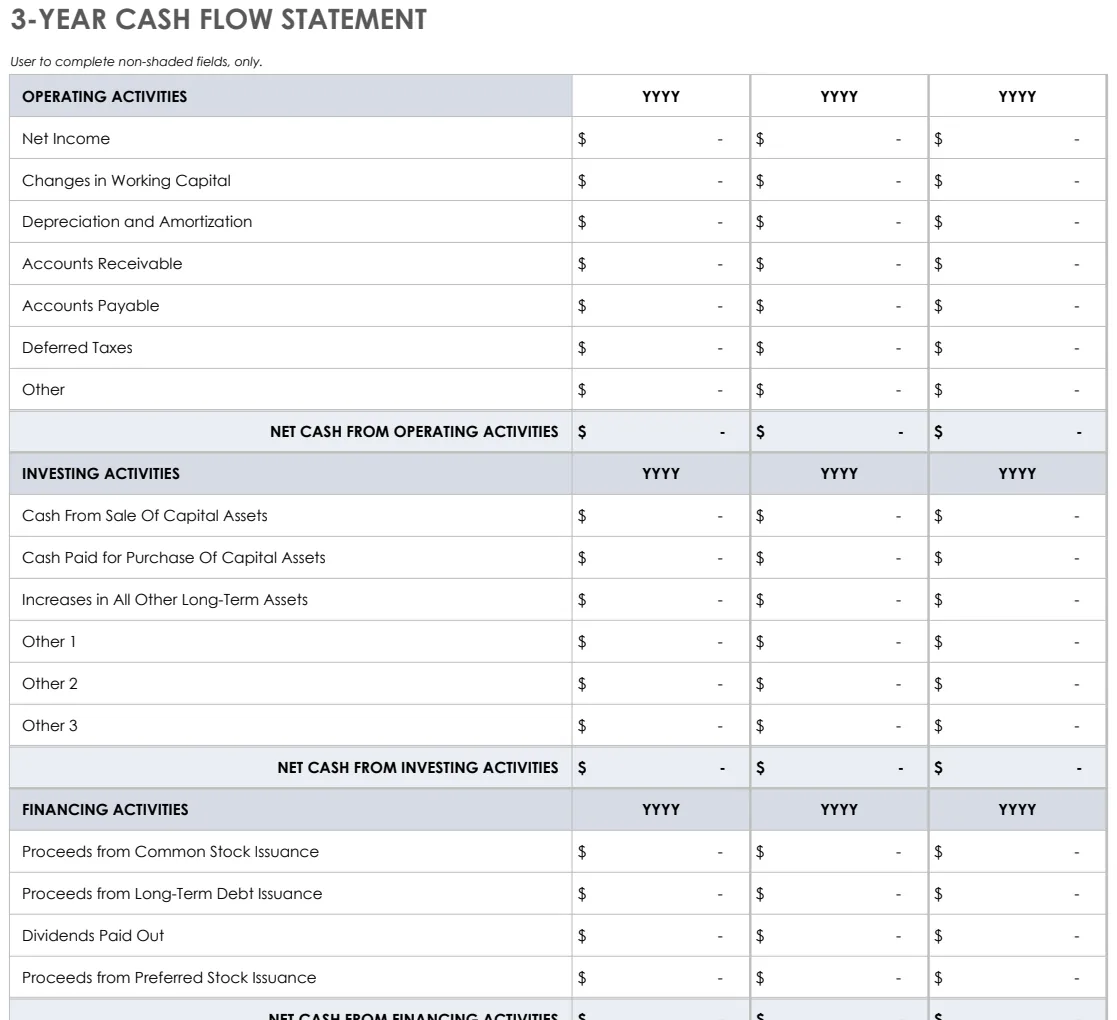
3 Year Cash Flow Statement
Track operating, investing, and financing cash flows across three years with pre-built formulas.
- Three statement formats (3-year, yearly, 12-month)
- Pre-built SUM formulas for automatic calculations
- Color-coded input areas for easy data entry
 Accounting & Bookkeeping
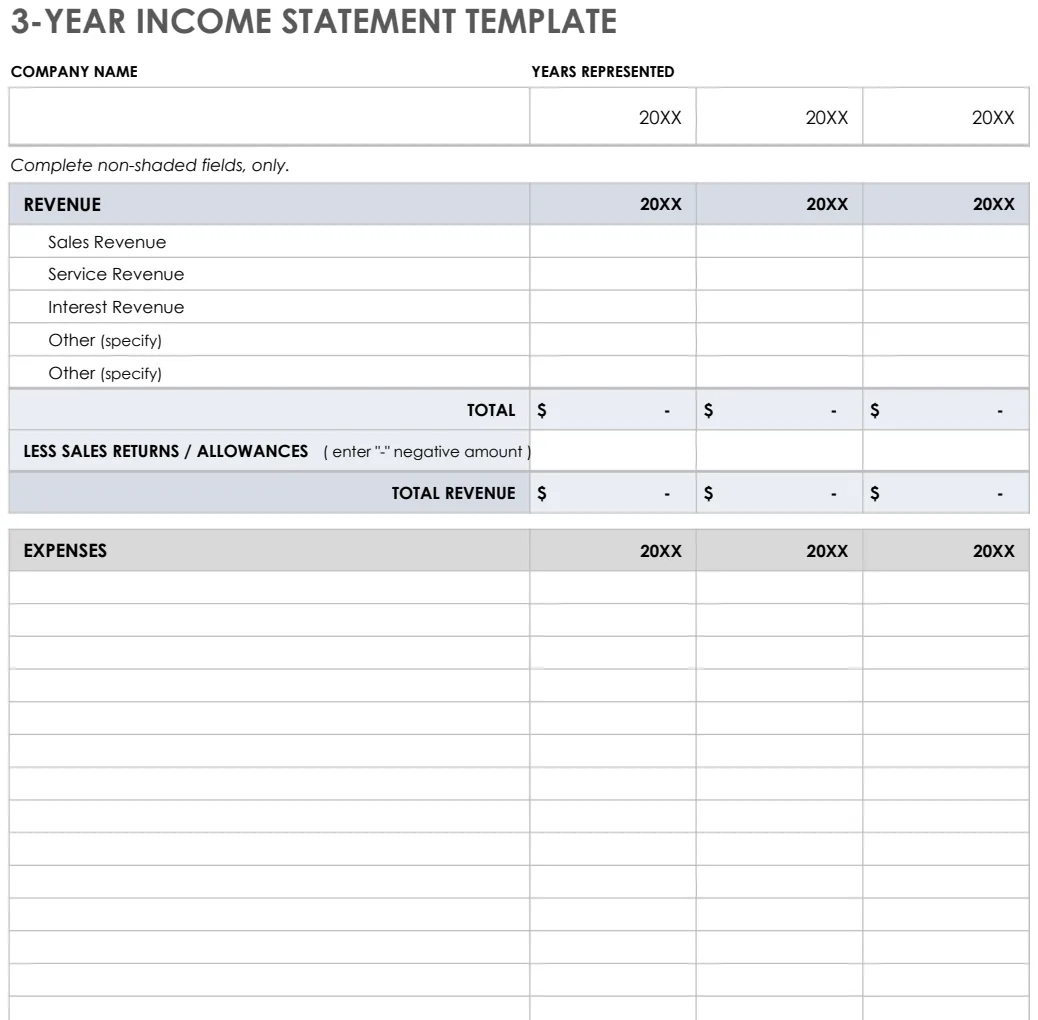
3 Year Income Statement
Track revenue, expenses, and net income across three years to analyze financial trends and performance.
- Pre-formatted rows for revenue and expense categories
- Automatic SUM formulas for totals and subtotals
- Three-year side-by-side comparison columns