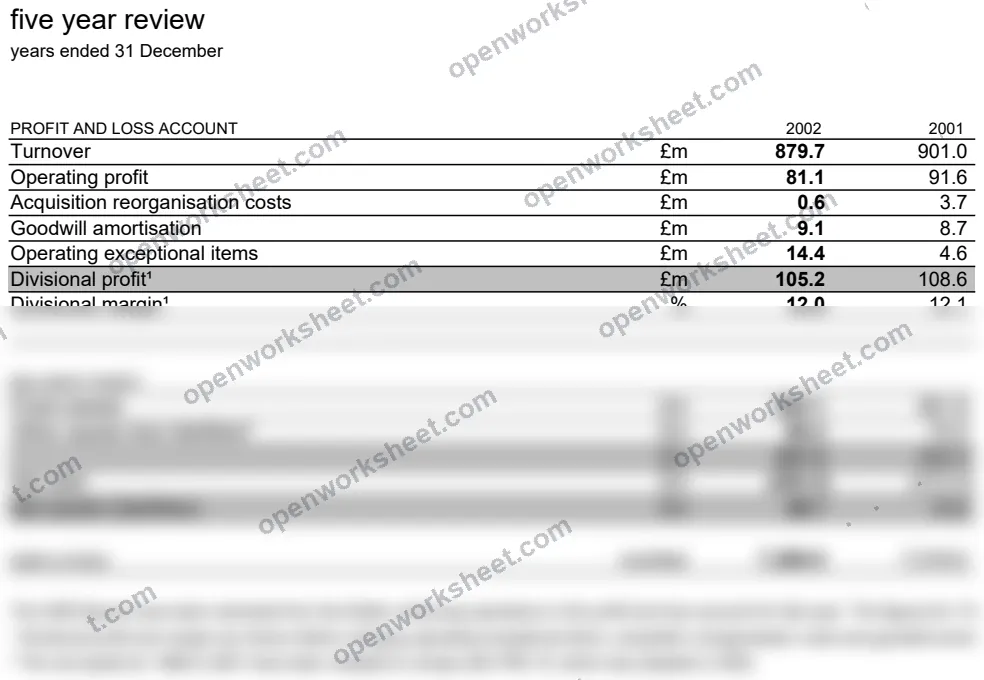
Five Year Profit and Loss Review
Track profit and loss trends across five years to identify financial growth patterns and performance
This financial statement template displays your P&L account across five consecutive years, enabling year-over-year comparison and trend analysis. It helps business owners, accountants, and financial analysts spot growth patterns, identify seasonal variations, and assess operational performance over time. Remove guesswork from strategic decisions by seeing exactly how profitability has evolved.
What's inside
- Five-year P&L comparison by line item
- Year-over-year performance visibility
- Trend analysis for revenue and expenses
- Professional financial statement layout
- Easy year-end reconciliation
Download this and everything else
.xlsx · 1 sheet
$29$9once for thousands of templates. No subscription.
- Limited-time offer, normally $29
- One payment, no subscription
- 14-day refund
More in Accounting & Bookkeeping
 Accounting & Bookkeeping
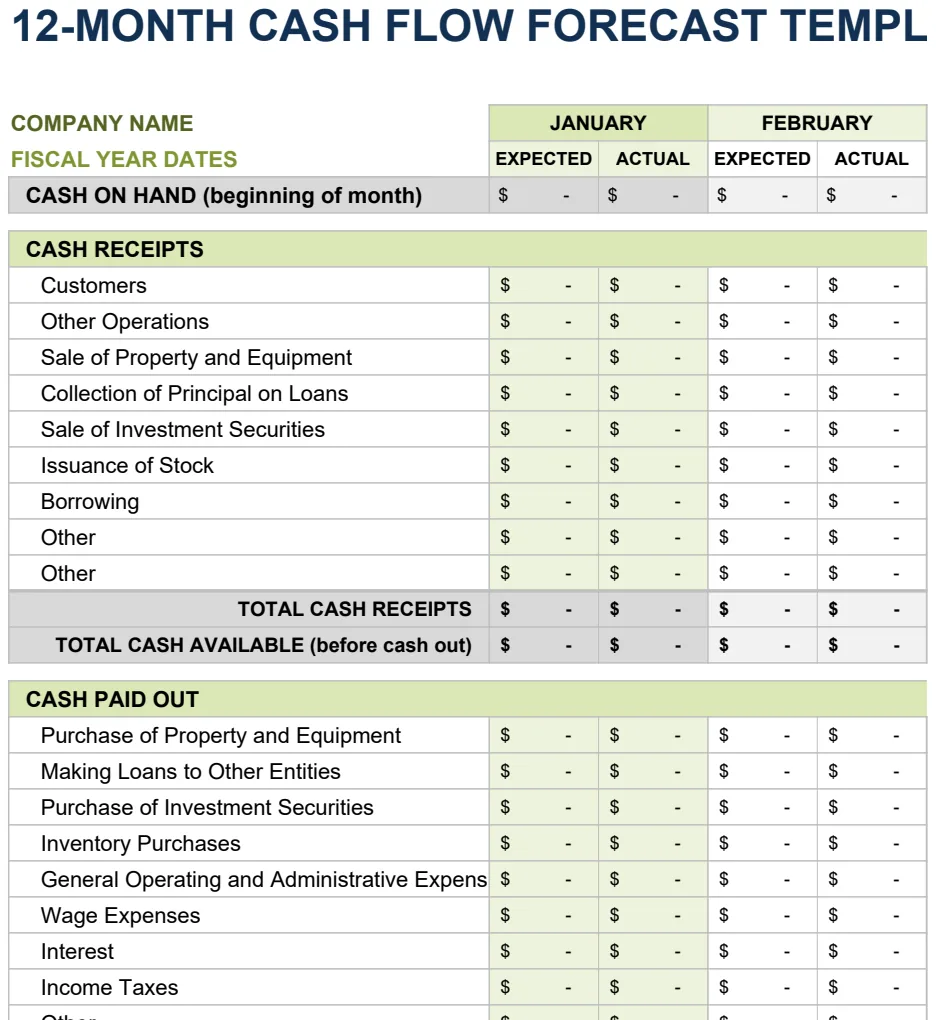
12 Month Cash Flow Forecast
Project monthly cash inflows and outflows to manage liquidity and plan for operating expenses.
- 12-month rolling forecast with expected vs. actual columns
- Month-by-month cash inflow and outflow tracking
- Automatic SUM calculations for cash position
 Accounting & Bookkeeping
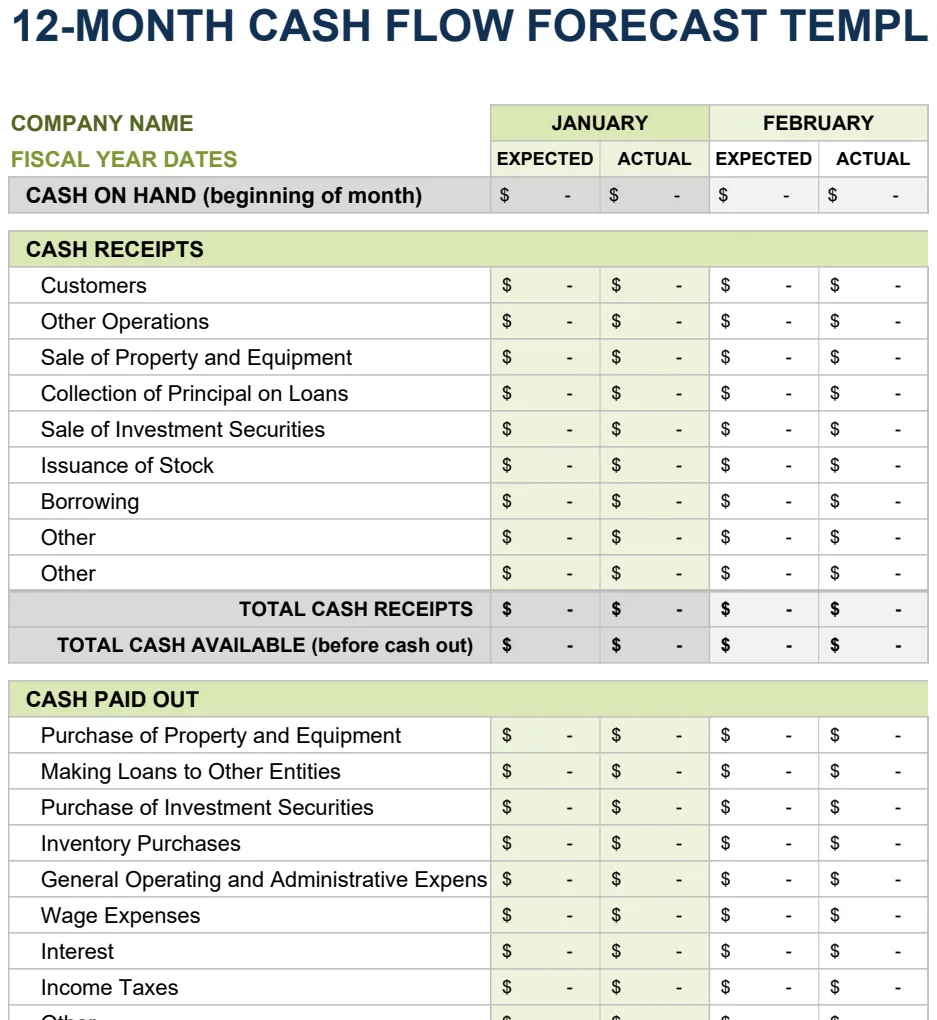
12 Month Cash Flow Forecast
Project monthly cash inflows and outflows to manage liquidity and financial planning.
- 12-month rolling projection with expected vs actual columns
- Monthly period comparison structure
- Automated SUM formulas for period totals
 Accounting & Bookkeeping
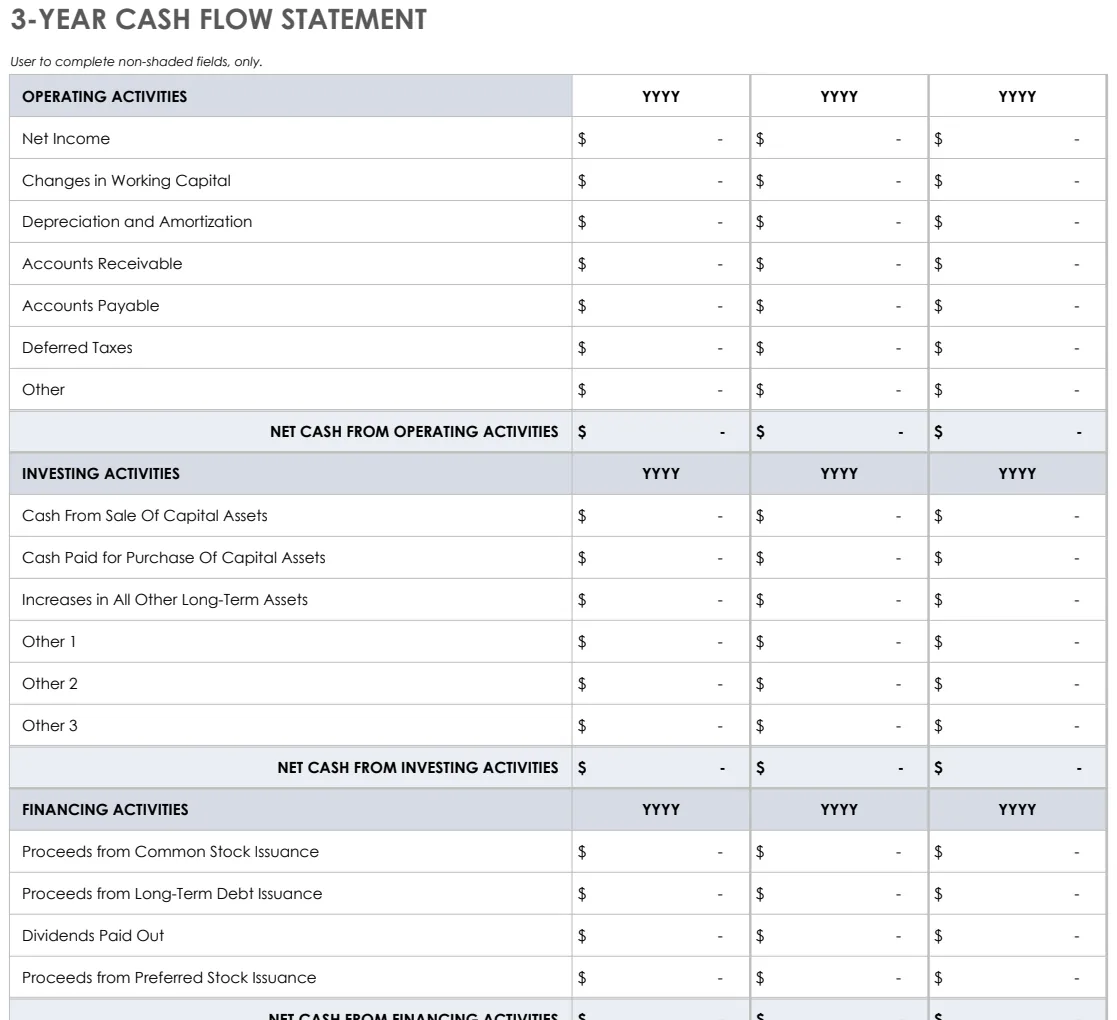
3 Year Cash Flow Statement
Track operating, investing, and financing cash flows across three years with pre-built formulas.
- Three statement formats (3-year, yearly, 12-month)
- Pre-built SUM formulas for automatic calculations
- Color-coded input areas for easy data entry
 Accounting & Bookkeeping
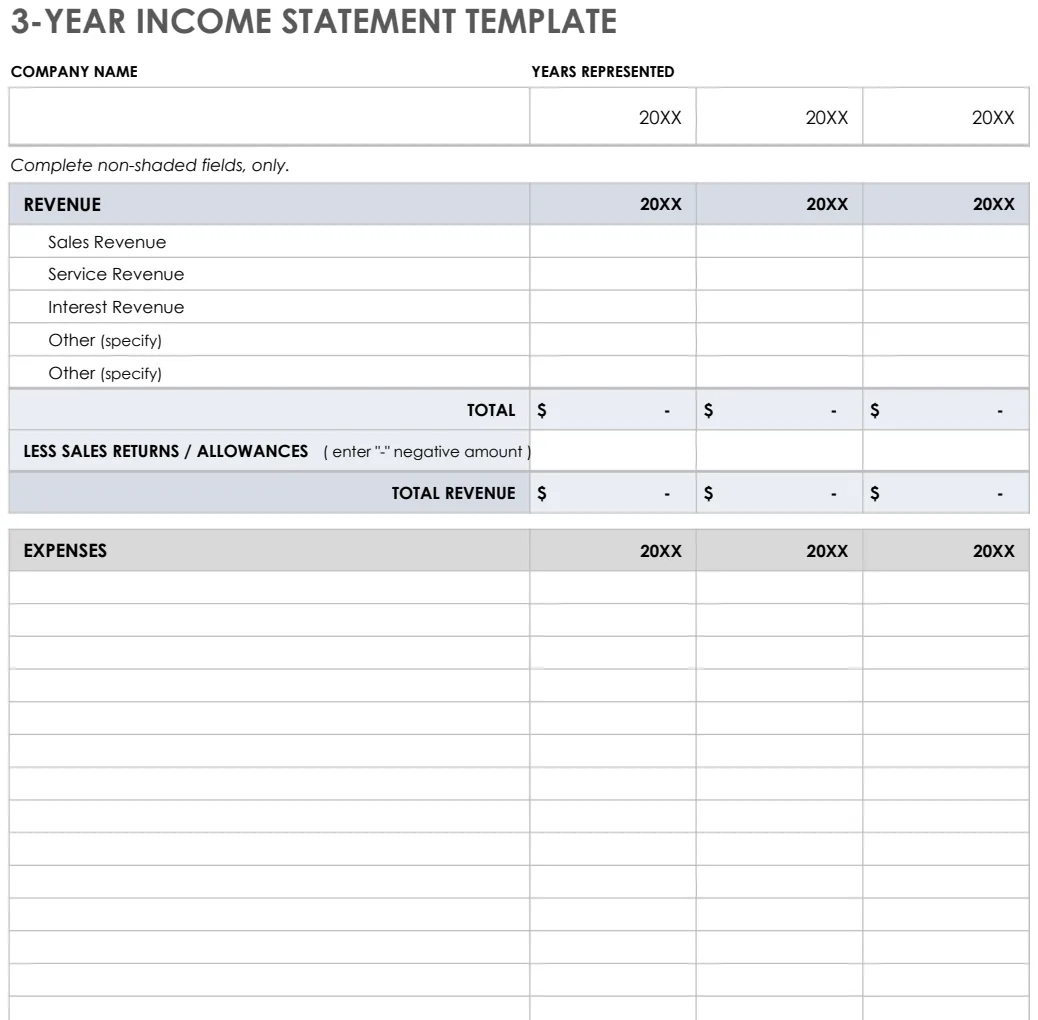
3 Year Income Statement
Track revenue, expenses, and net income across three years to analyze financial trends and performance.
- Pre-formatted rows for revenue and expense categories
- Automatic SUM formulas for totals and subtotals
- Three-year side-by-side comparison columns