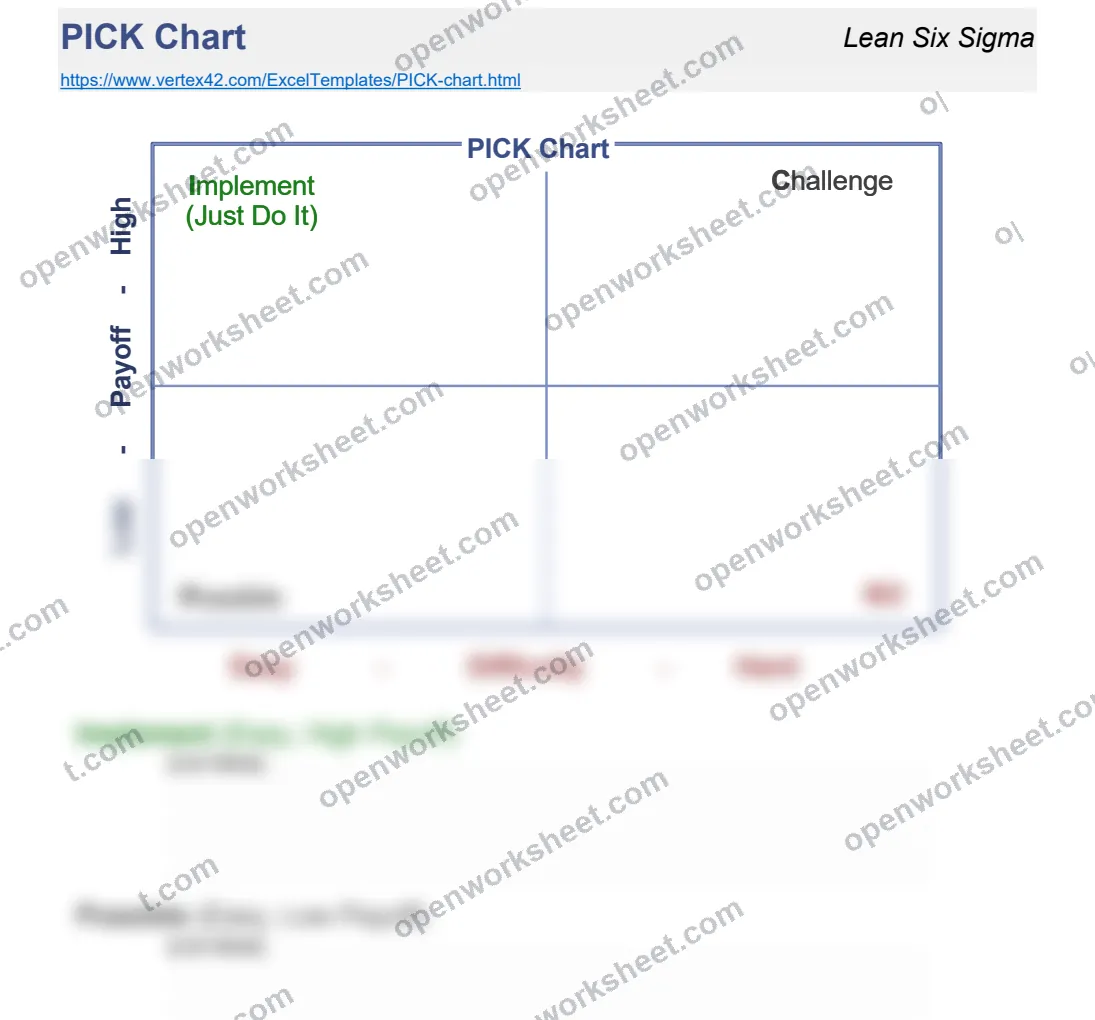
PICK Chart for Lean Six Sigma
Prioritize improvement initiatives using the PICK matrix—payoff, implementability, complexity, and knowledge.
The PICK Chart helps organizations evaluate and prioritize potential improvement projects using four key dimensions: Payoff (benefit impact), Implementability (ease of execution), Complexity (resource requirements), and Knowledge (team expertise). This tool is ideal for Lean Six Sigma practitioners, process improvement teams, and business managers deciding which initiatives deliver the most value with manageable effort. It removes the guesswork from project selection by visually mapping opportunities across a 2×2 matrix, enabling data-driven prioritization.
What's inside
- 2x2 prioritization matrix
- Payoff vs. Implementability visualization
- Project plotting and categorization
- Visual decision framework
- Color-coded quadrants
- Easy sorting into Quick Wins, Major Projects, Fill-ins, and Time Wasters
Download this and everything else
.xlsx · 2 sheets · includes charts
$29$9once for thousands of templates. No subscription.
- Limited-time offer, normally $29
- One payment, no subscription
- 14-day refund
More in Business Planning & Strategy
 Business Planning & Strategy
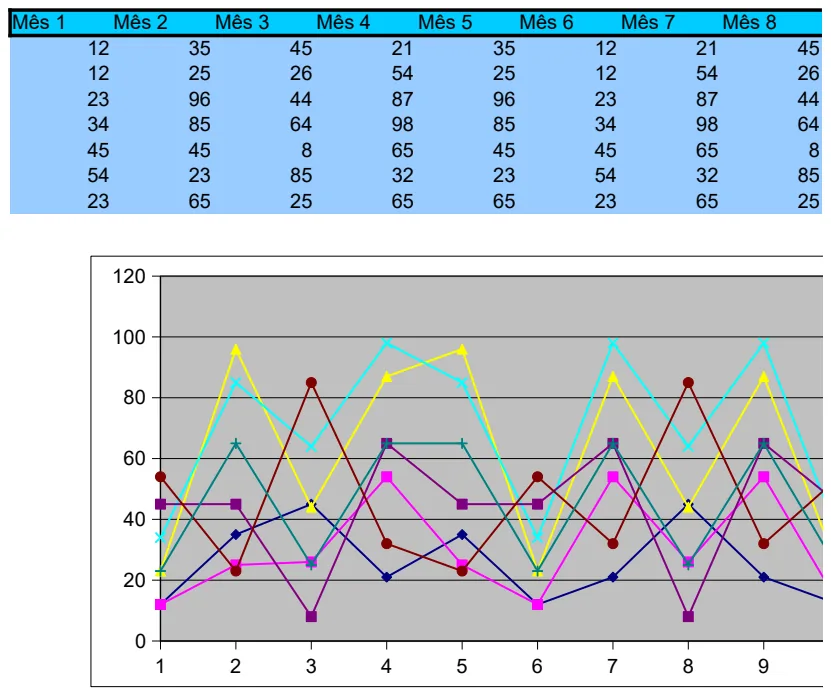
12-Month Business Performance Tracker
Track and visualize monthly performance metrics across a full year with built-in charts.
- 12-month column structure (Mês 1-12)
- Pre-built sample data for immediate visualization
- Integrated charts for trend analysis
 Business Planning & Strategy
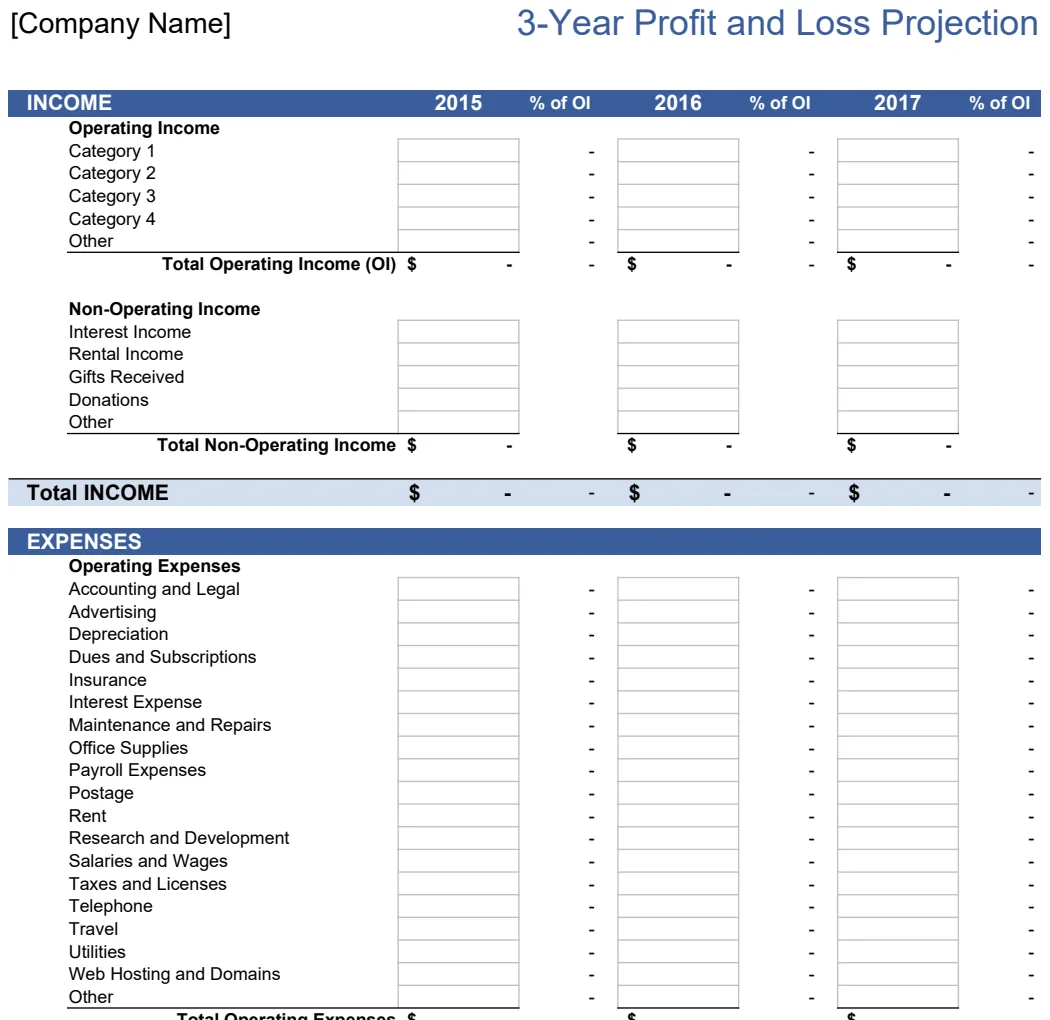
3-Year Profit and Loss Projection
Project revenue, expenses, and net profit across three years for services or goods businesses.
- Separate projections for service and product-based revenue models
- Annual profit margin analysis as percentage of operating income or sales
- Automatic calculations for total expenses and net profit
 Business Planning & Strategy
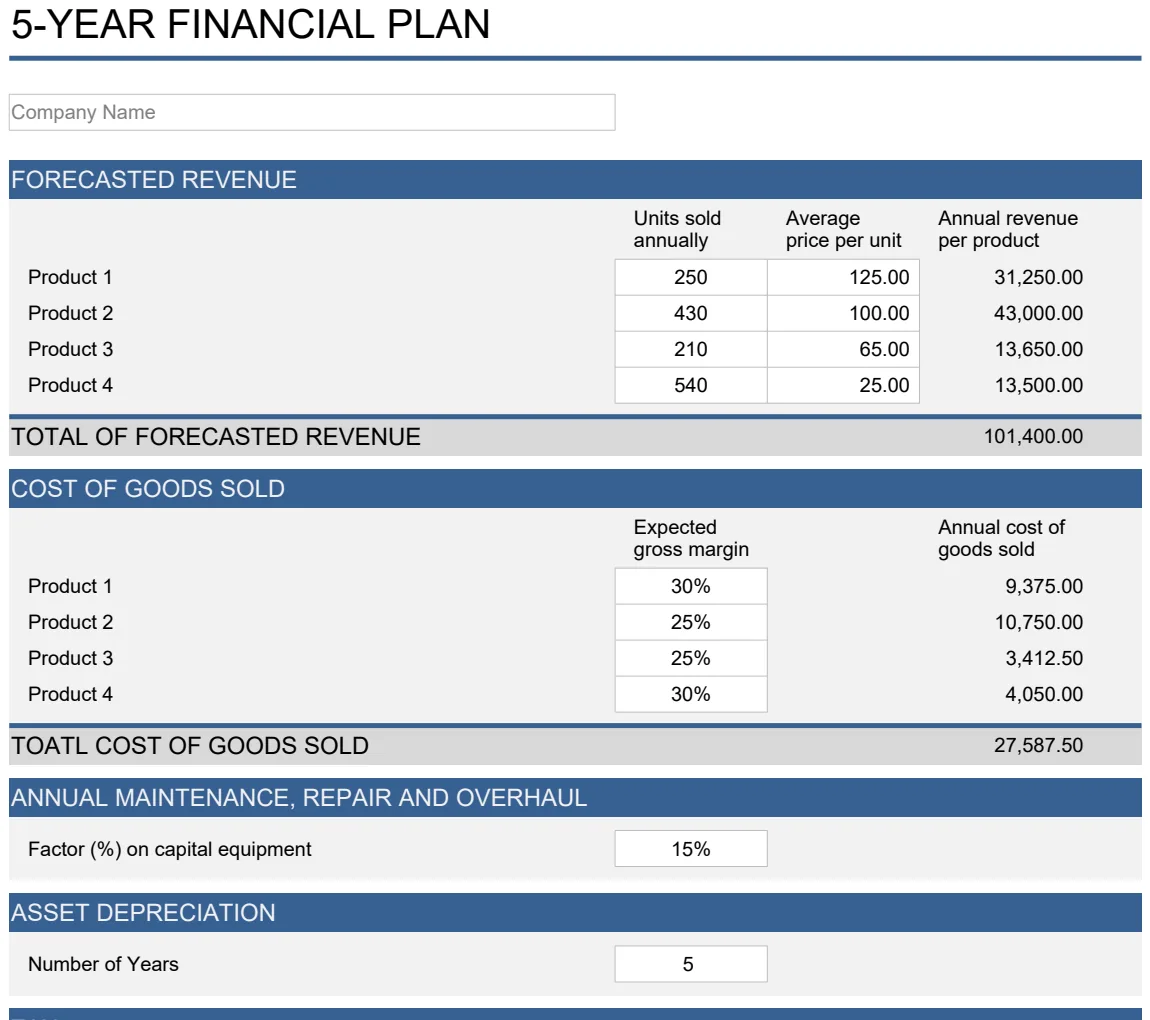
5 Year Financial Plan
Project revenue, expenses, and cash flow across 5 years with P&L, balance sheet, and loan amortization.
- 5-year revenue and expense forecasting
- Profit and loss projection with assumptions
- Balance sheet projection with asset tracking
 Business Planning & Strategy
5 Year Projected Financial Statements
Complete financial projections with P&L, balance sheet, cash flow, and loan amortization for 5-year business planning.
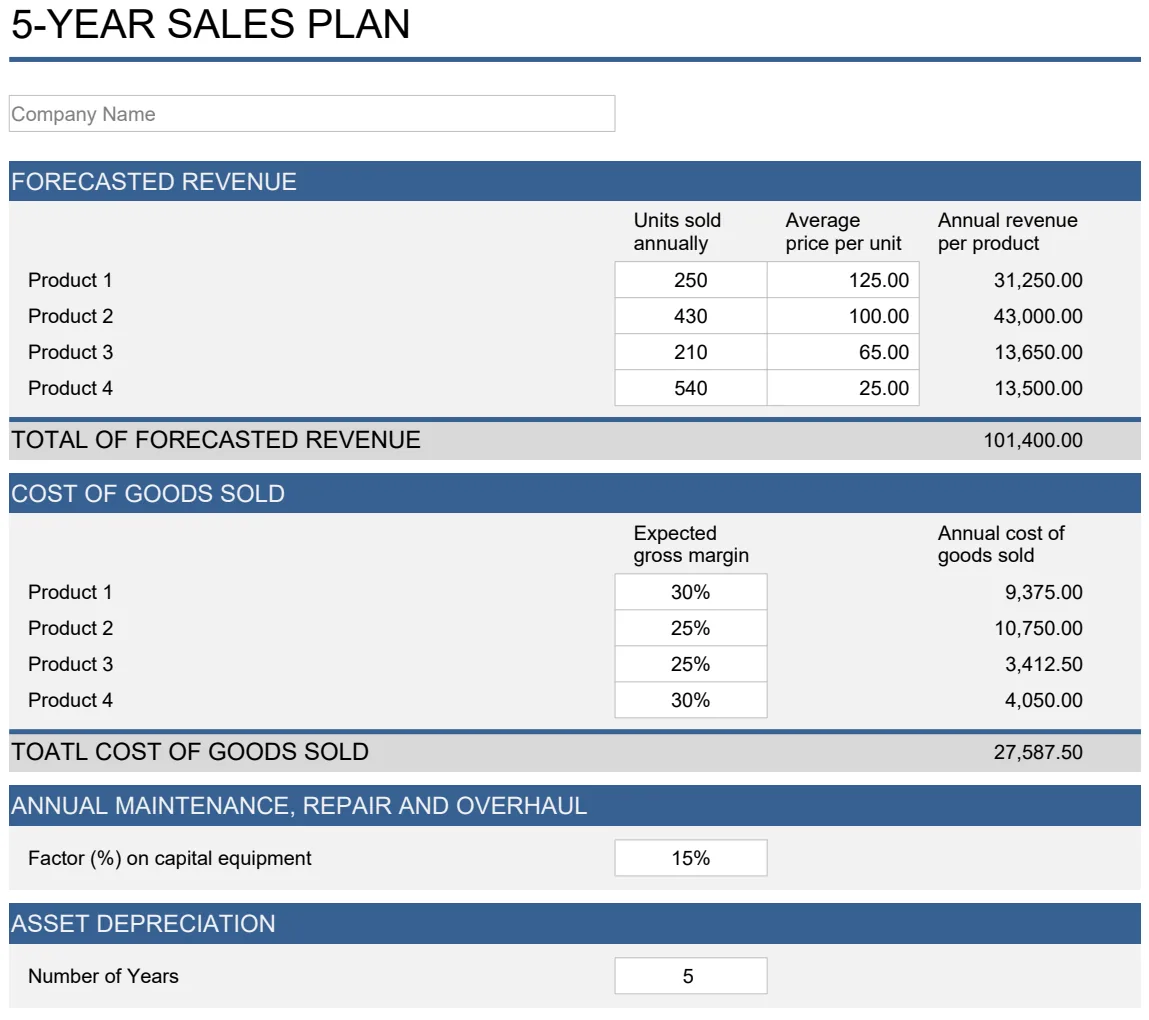
- 5-year sales and revenue forecasting
- Automated P&L projection calculations
- Balance sheet projections with asset tracking