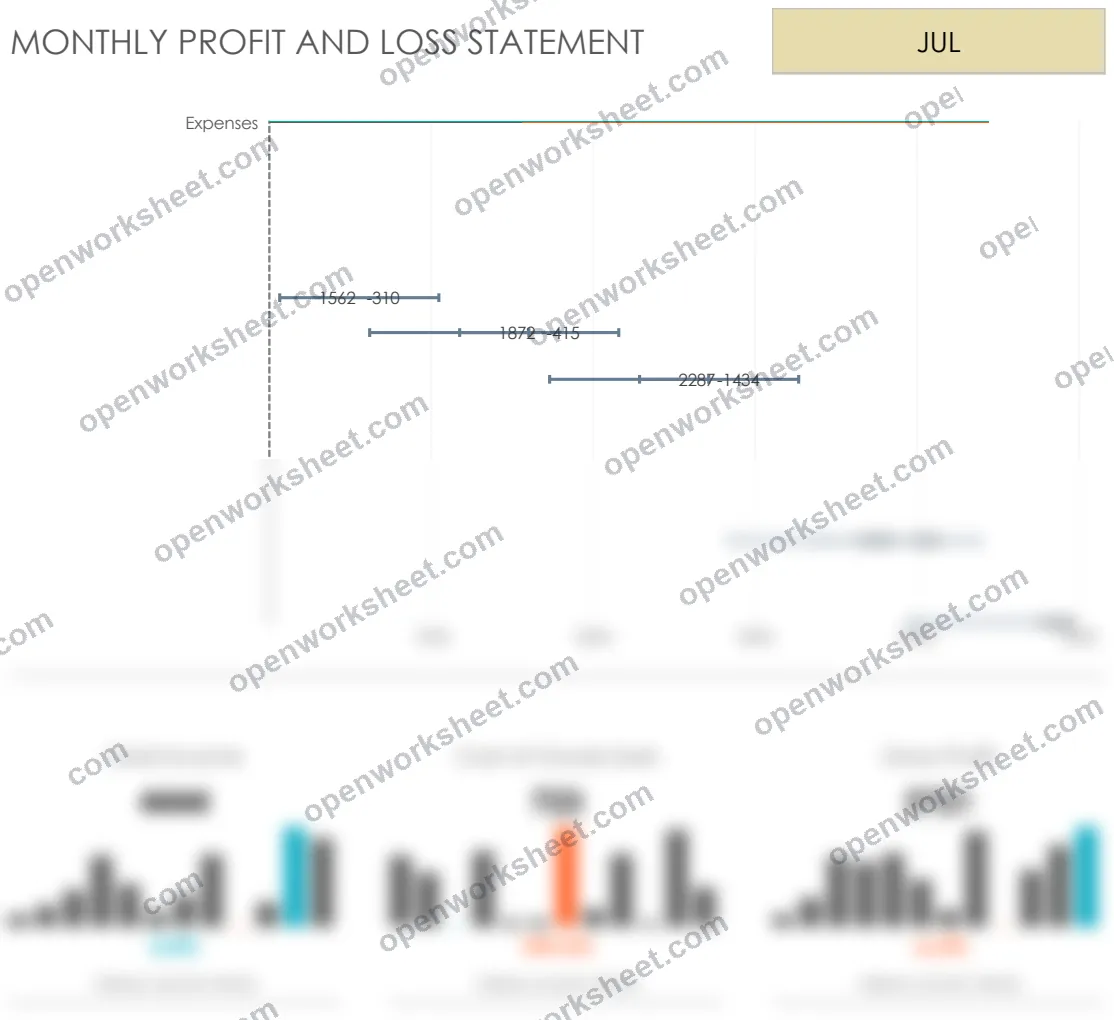
Profit and Loss Dashboard
Monthly P&L statement template with automated calculations and visual dashboard for tracking revenue and expenses.
This template provides a structured profit and loss dashboard that automatically calculates net income from monthly revenue and expense data. Users enter transaction data in a dedicated input sheet, and the dashboard displays the selected month's P&L statement with calculated totals, making it easy to monitor profitability trends.
Ideal for small business owners, accountants, and finance managers who need quick monthly profitability snapshots. It eliminates manual calculation errors and provides clear visibility into income statement performance without complex spreadsheet setup.
What's inside
- Monthly P&L statement view
- Automated calculation formulas
- Data input sheet with category tracking
- Visual dashboard with charts
- Dropdown month selector
Download this and everything else
.xlsx · 4 sheets · includes charts
$29$9once for thousands of templates. No subscription.
- Limited-time offer, normally $29
- One payment, no subscription
- 14-day refund
More in Accounting & Bookkeeping
 Accounting & Bookkeeping
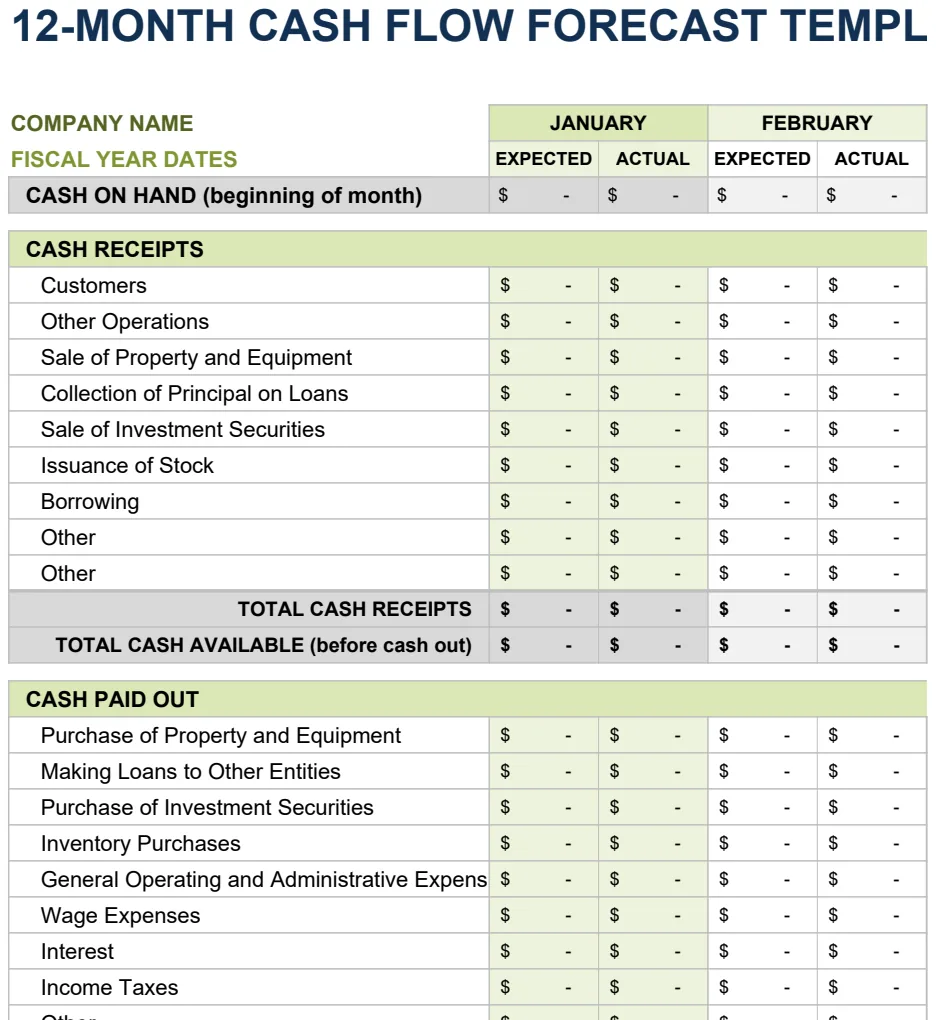
12 Month Cash Flow Forecast
Project monthly cash inflows and outflows to manage liquidity and plan for operating expenses.
- 12-month rolling forecast with expected vs. actual columns
- Month-by-month cash inflow and outflow tracking
- Automatic SUM calculations for cash position
 Accounting & Bookkeeping
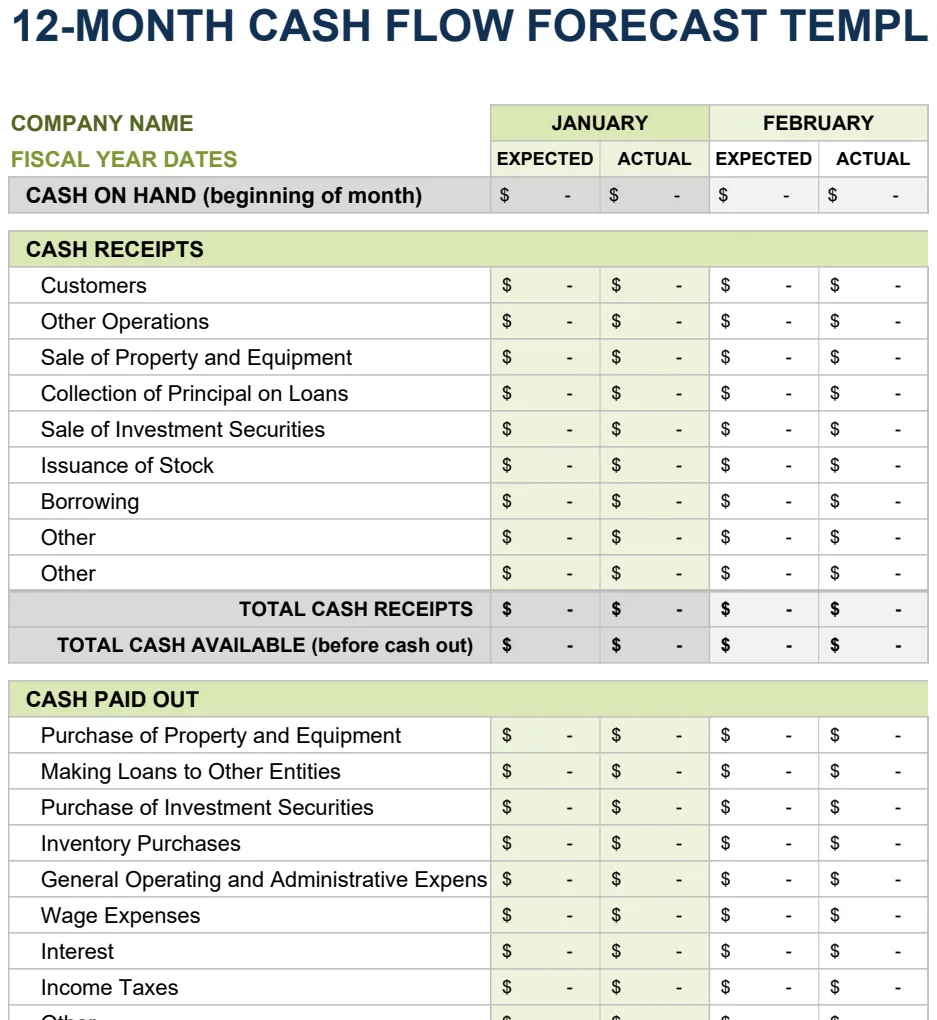
12 Month Cash Flow Forecast
Project monthly cash inflows and outflows to manage liquidity and financial planning.
- 12-month rolling projection with expected vs actual columns
- Monthly period comparison structure
- Automated SUM formulas for period totals
 Accounting & Bookkeeping
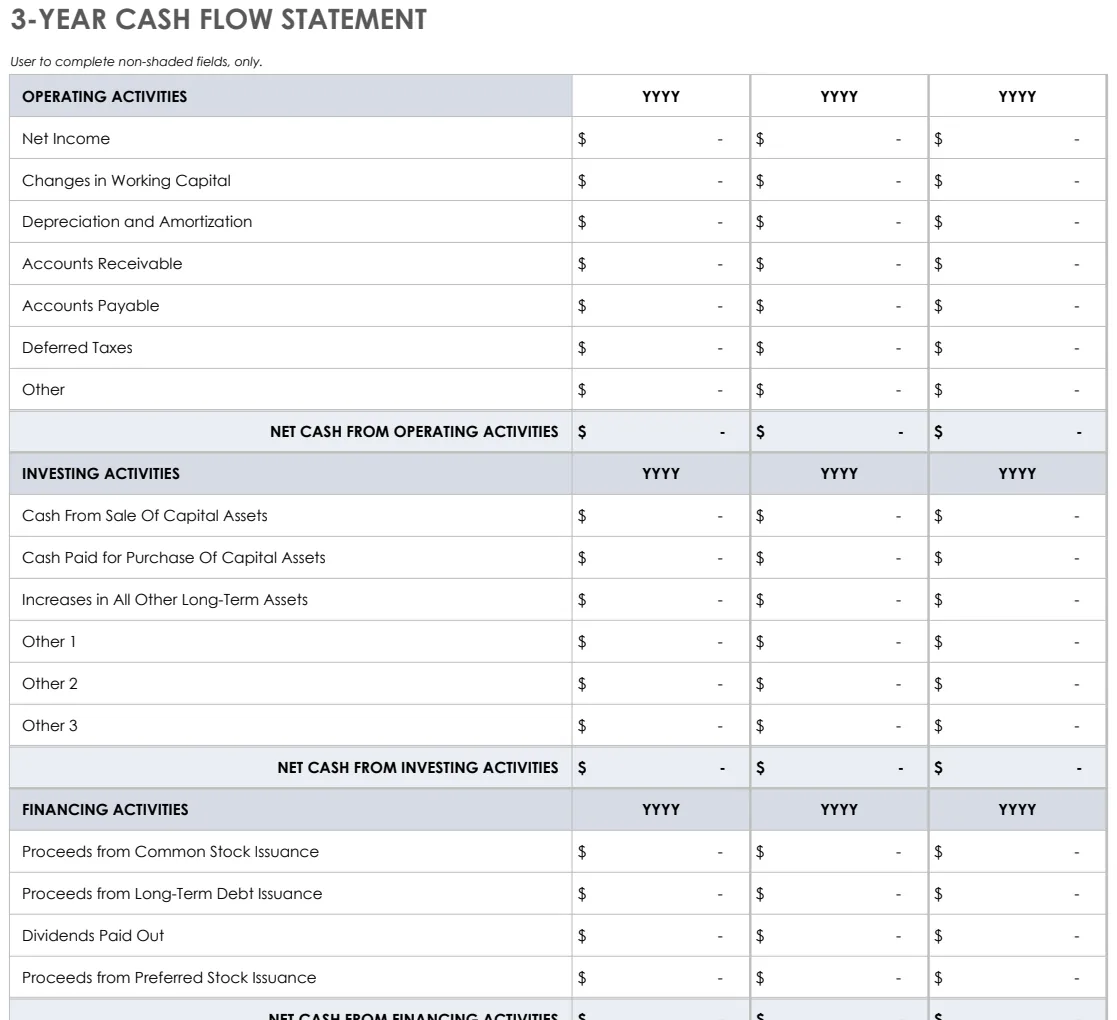
3 Year Cash Flow Statement
Track operating, investing, and financing cash flows across three years with pre-built formulas.
- Three statement formats (3-year, yearly, 12-month)
- Pre-built SUM formulas for automatic calculations
- Color-coded input areas for easy data entry
 Accounting & Bookkeeping
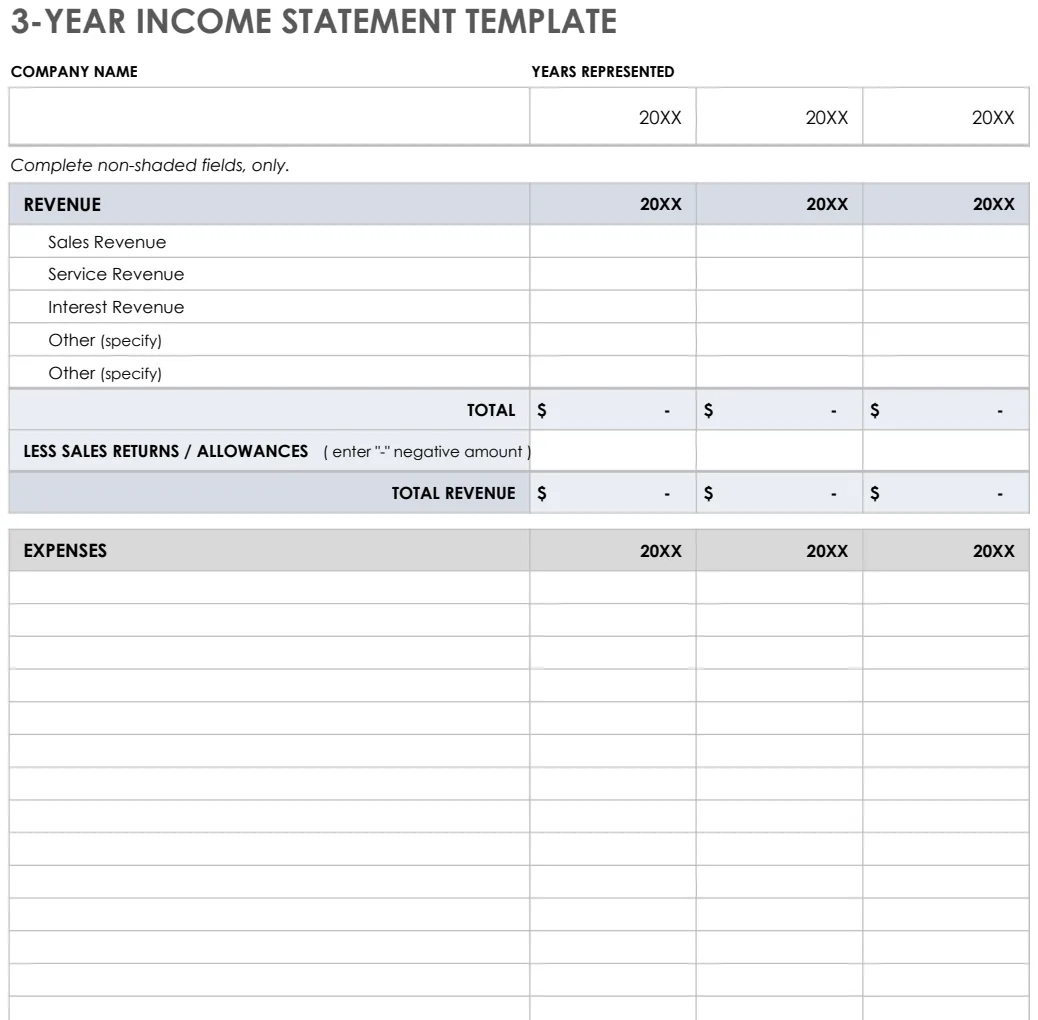
3 Year Income Statement
Track revenue, expenses, and net income across three years to analyze financial trends and performance.
- Pre-formatted rows for revenue and expense categories
- Automatic SUM formulas for totals and subtotals
- Three-year side-by-side comparison columns