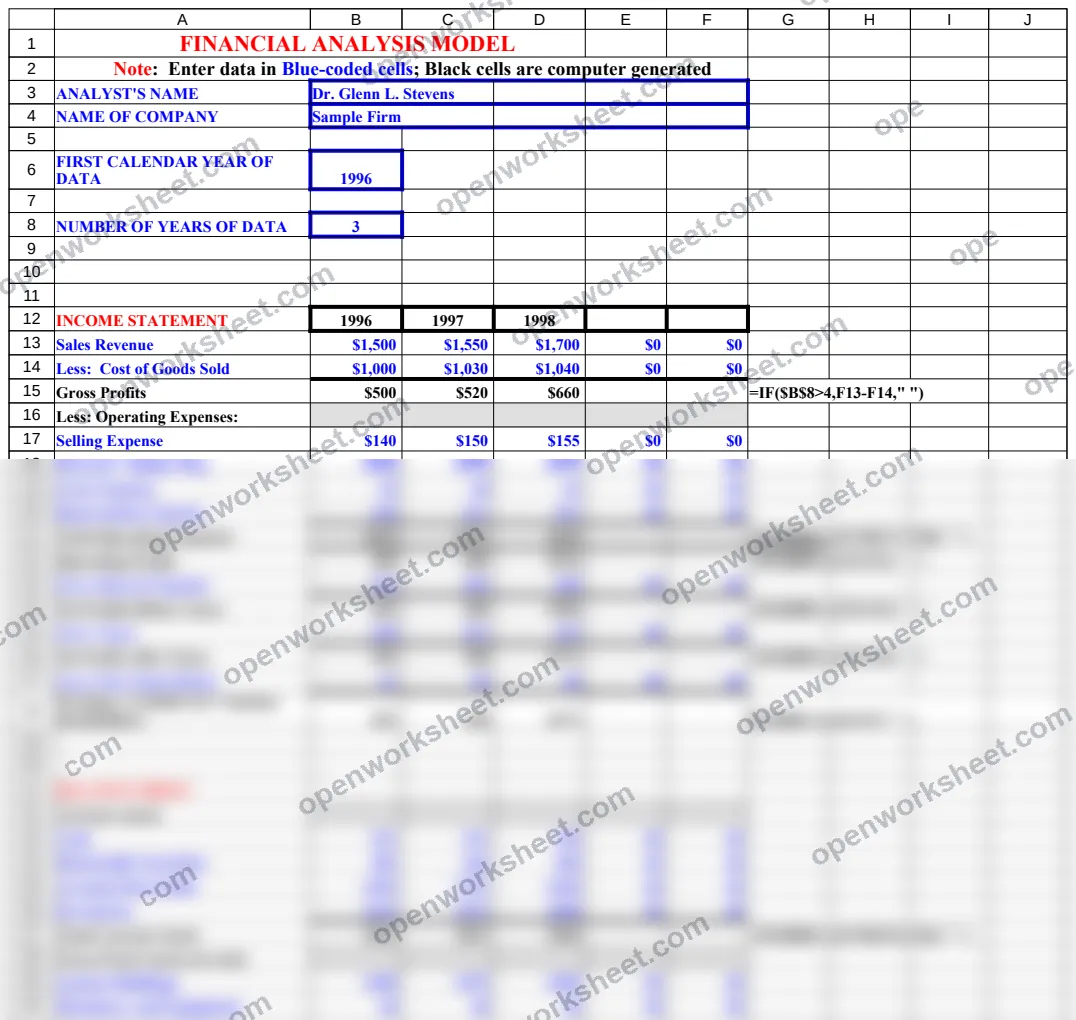
Ratio Analysis
Analyze financial performance using key ratios, trends, and metrics from your financial statements.
This financial analysis model calculates and interprets key financial ratios to assess company performance, liquidity, profitability, and leverage. Input your balance sheet and income statement data into the blue-coded cells, and the template automatically computes critical ratios and generates insights. Perfect for business owners, financial analysts, and investors who need to understand financial health quickly and identify performance trends.
What's inside
- Automated ratio calculations
- Pre-built financial ratio formulas
- Color-coded input cells
- Multi-period analysis capability
- Key metrics dashboard
Download this and everything else
.xlsx · 16 sheets
$29$9once for thousands of templates. No subscription.
- Limited-time offer, normally $29
- One payment, no subscription
- 14-day refund
More in Accounting & Bookkeeping
 Accounting & Bookkeeping
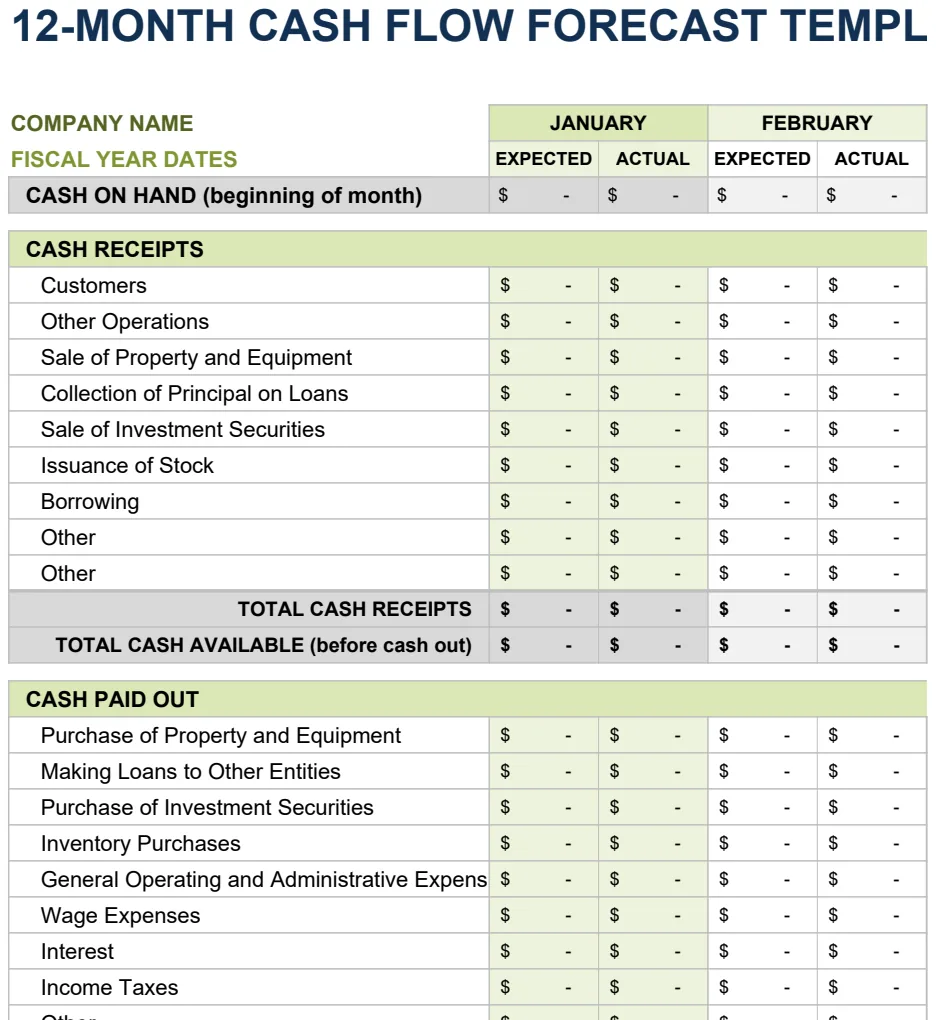
12 Month Cash Flow Forecast
Project monthly cash inflows and outflows to manage liquidity and plan for operating expenses.
- 12-month rolling forecast with expected vs. actual columns
- Month-by-month cash inflow and outflow tracking
- Automatic SUM calculations for cash position
 Accounting & Bookkeeping
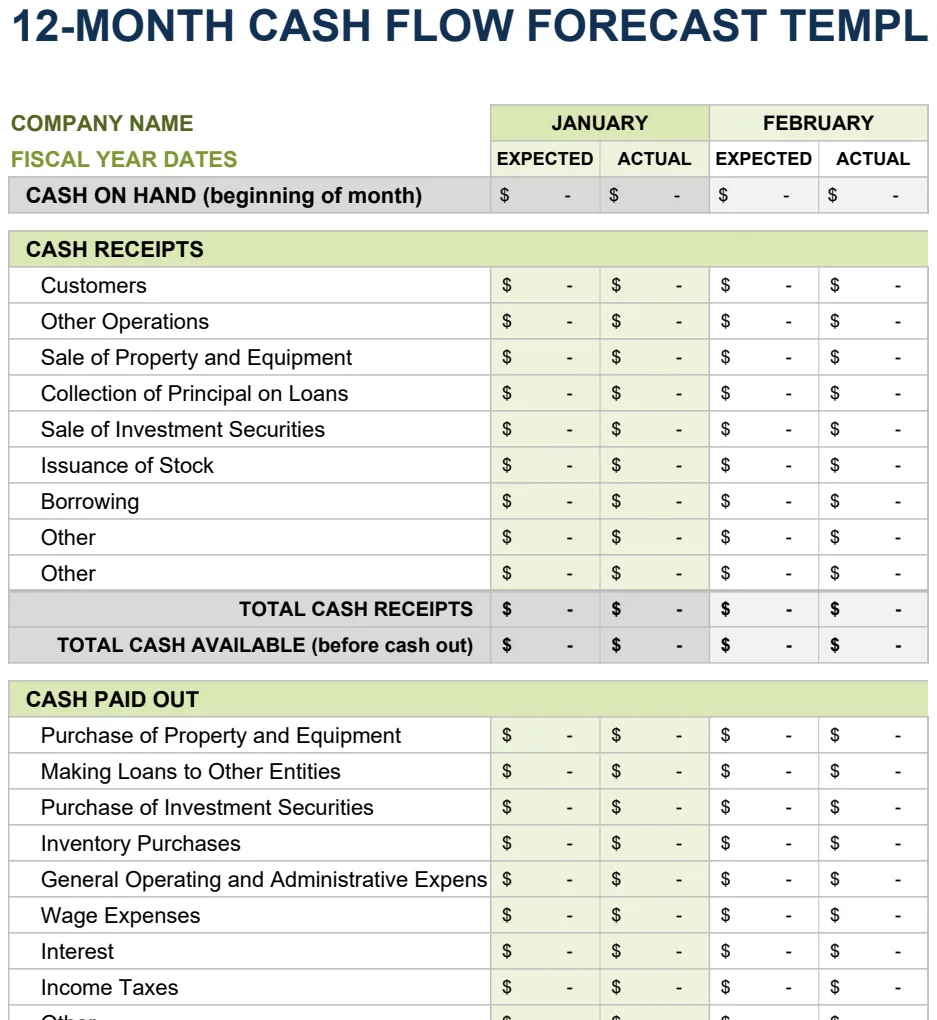
12 Month Cash Flow Forecast
Project monthly cash inflows and outflows to manage liquidity and financial planning.
- 12-month rolling projection with expected vs actual columns
- Monthly period comparison structure
- Automated SUM formulas for period totals
 Accounting & Bookkeeping
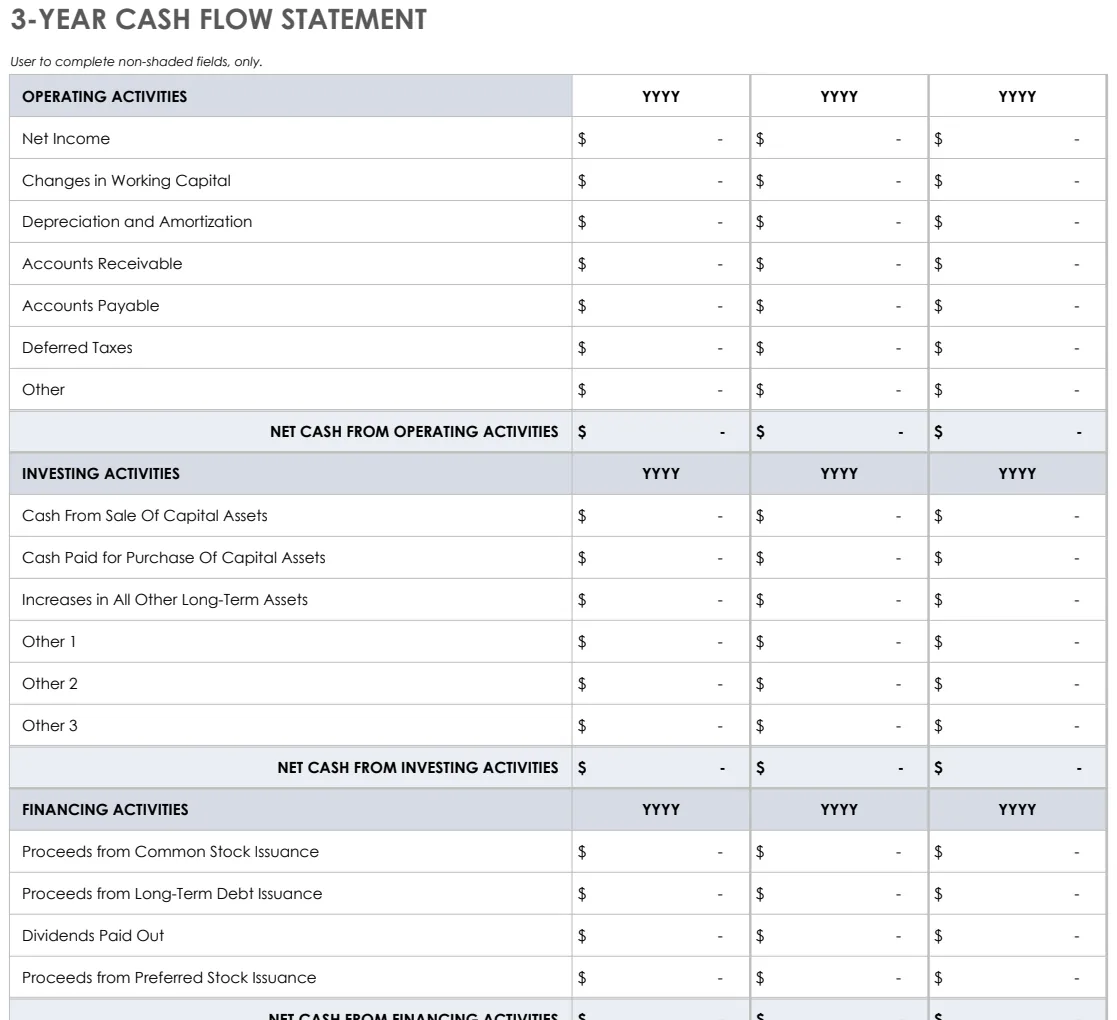
3 Year Cash Flow Statement
Track operating, investing, and financing cash flows across three years with pre-built formulas.
- Three statement formats (3-year, yearly, 12-month)
- Pre-built SUM formulas for automatic calculations
- Color-coded input areas for easy data entry
 Accounting & Bookkeeping
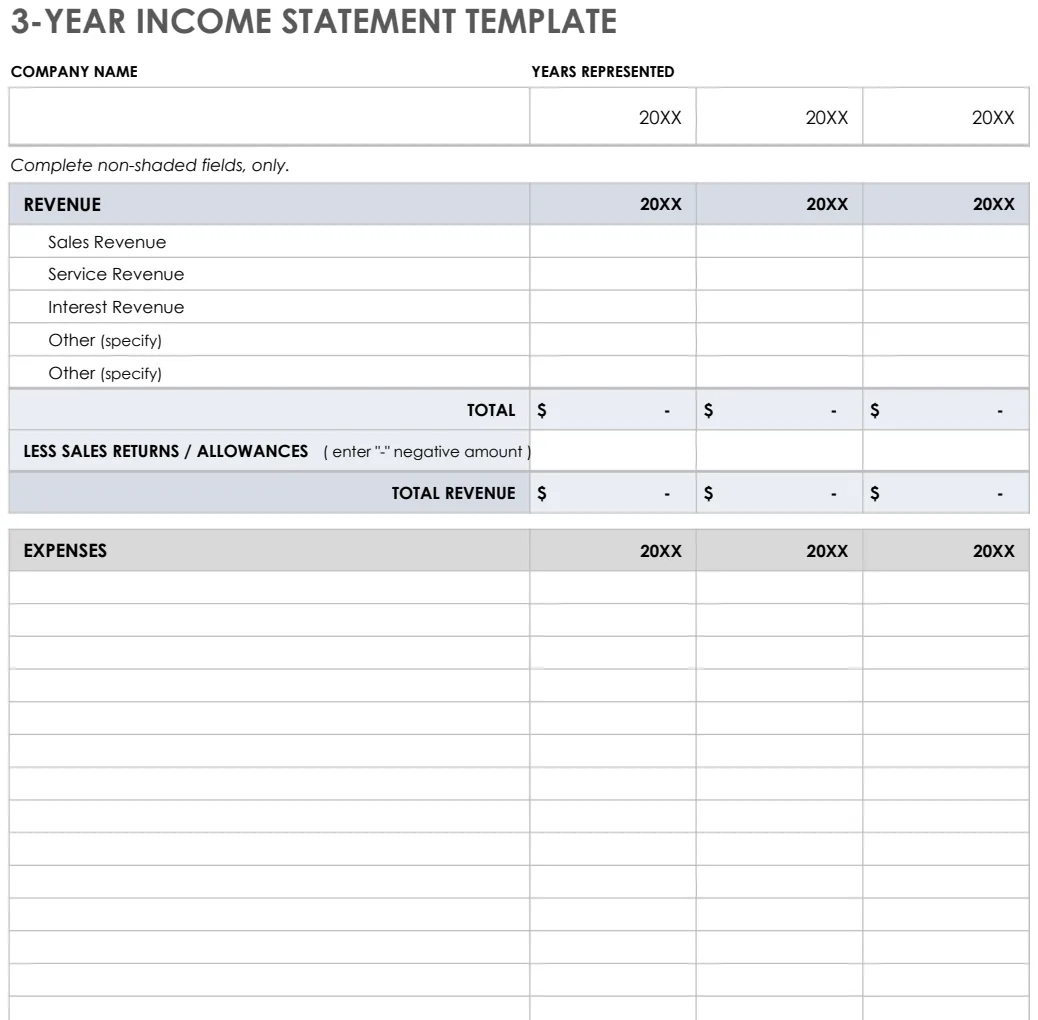
3 Year Income Statement
Track revenue, expenses, and net income across three years to analyze financial trends and performance.
- Pre-formatted rows for revenue and expense categories
- Automatic SUM formulas for totals and subtotals
- Three-year side-by-side comparison columns