Sales Dashboard Template
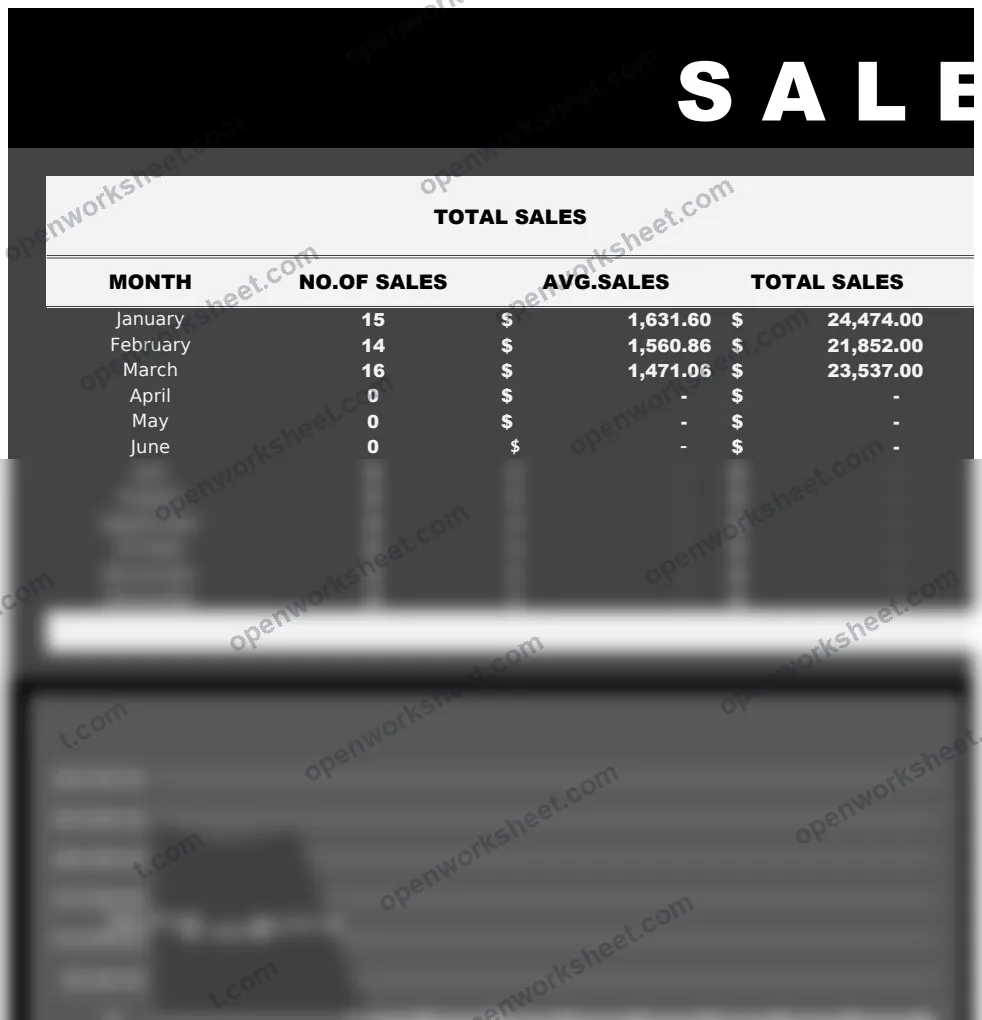
A comprehensive sales tracking and dashboard template featuring real-time sales metrics, commission calculations, and performance analytics across multiple sales managers and product types.
This Sales Dashboard Template provides a complete system for tracking and analyzing sales performance across an organization. It includes a dynamic dashboard sheet that displays total sales, number of transactions, average sales, and total revenue with month-by-month breakdowns. The Sales Data sheet captures detailed transaction information including sale dates, client names, locations, sales managers, sale amounts, and commission calculations. The Set Up sheet allows configuration of sales managers, order statuses, product types, and lead sources. Advanced Excel functions enable automatic calculations, filtering, and performance summarization to support data-driven sales decision-making.
What's inside
- Dynamic dashboard with key performance indicators
- Automated commission calculations
- Monthly sales summaries and aggregations
- Sales data organization by date, manager, and product
- Chart visualizations for trend analysis
- Configurable setup parameters for managers and products
- Geographic sales analysis by city and state
Download this template
.xlsx · 3 sheets · includes charts
$9/monthDownload up to 10 templates a month from a library of thousands. Cancel anytime.
- 10 downloads every month
- Cancel anytime
- 14-day refund
More in Sales & CRM
 Sales & CRM
12 Month Sales Forecast
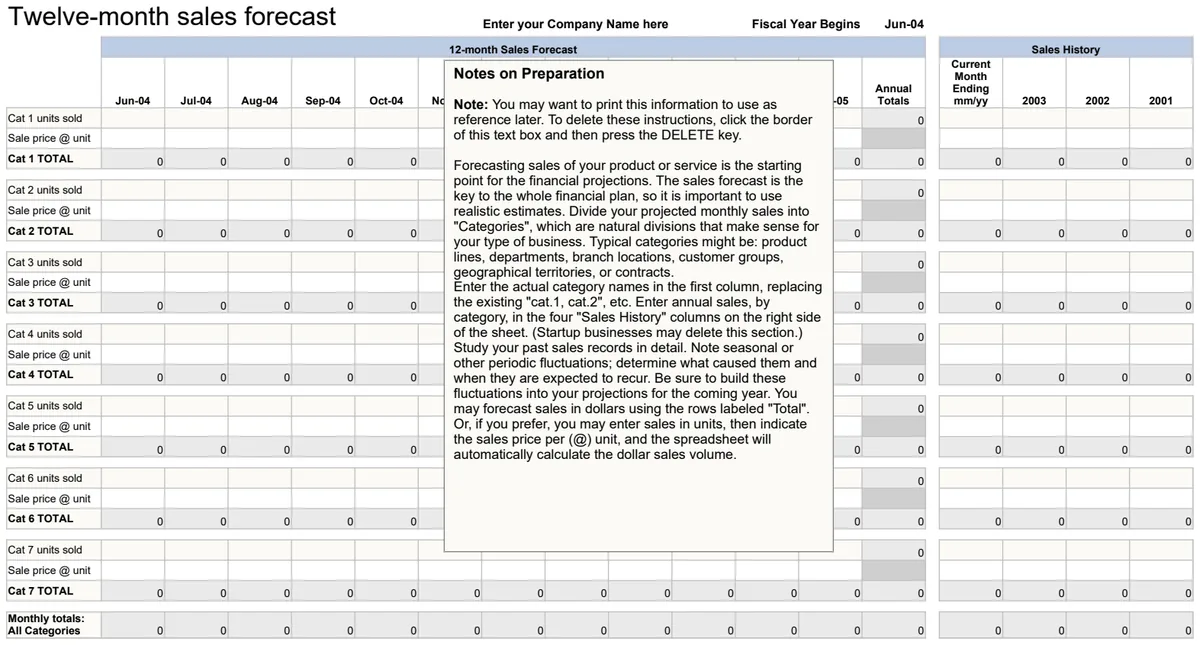
Project monthly revenue for the next 12 months with automated date calculations and totals.
- Automated month-by-month date generation
- Monthly sales amount entry fields
- Running total calculations across the year
 Sales & CRM
12 Month Sales Forecast Multiple Projects
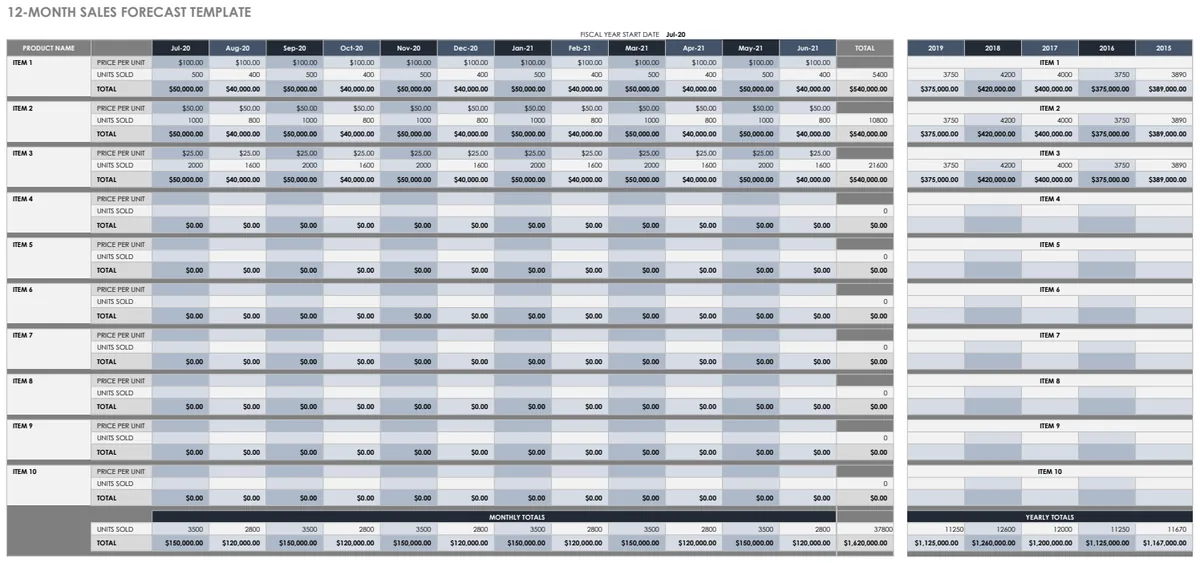
Project-based sales forecasting across 12 months with pricing and unit tracking.
- 12-month rolling forecast view
- Multiple product/project lines
- Unit price and quantity tracking
 Sales & CRM
12-Month Sales Forecast
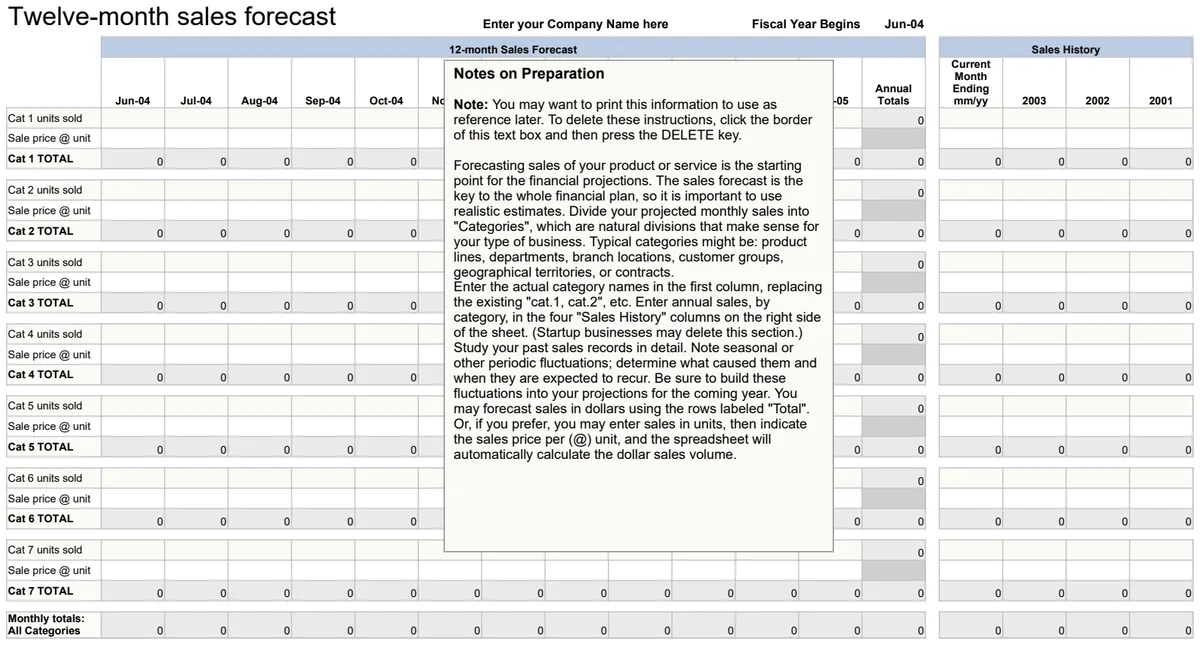
Project monthly revenue with automatic date calculations and rolling totals for annual planning.
- Automatic month-by-month date progression
- Summary totals for quarterly and annual sales
- Company name and fiscal year customization
 Sales & CRM
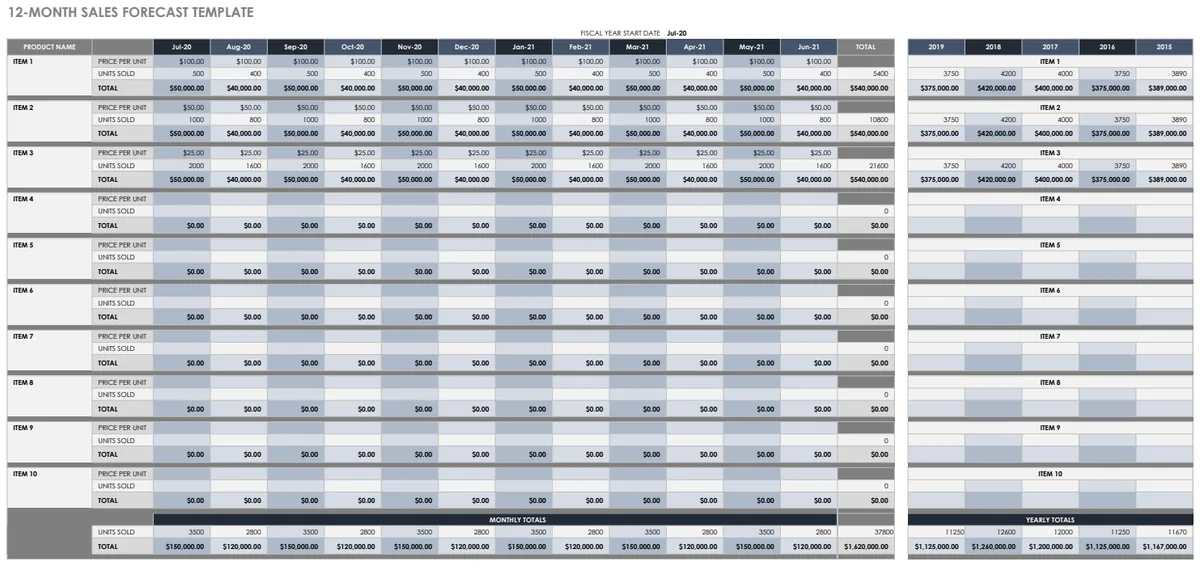
12-Month Sales Forecast Template
Project monthly revenue by product to plan inventory, staffing, and cash flow confidently.
- 12-month sales projection grid by product
- Automatic date calculation for each month
- Unit price and quantity tracking