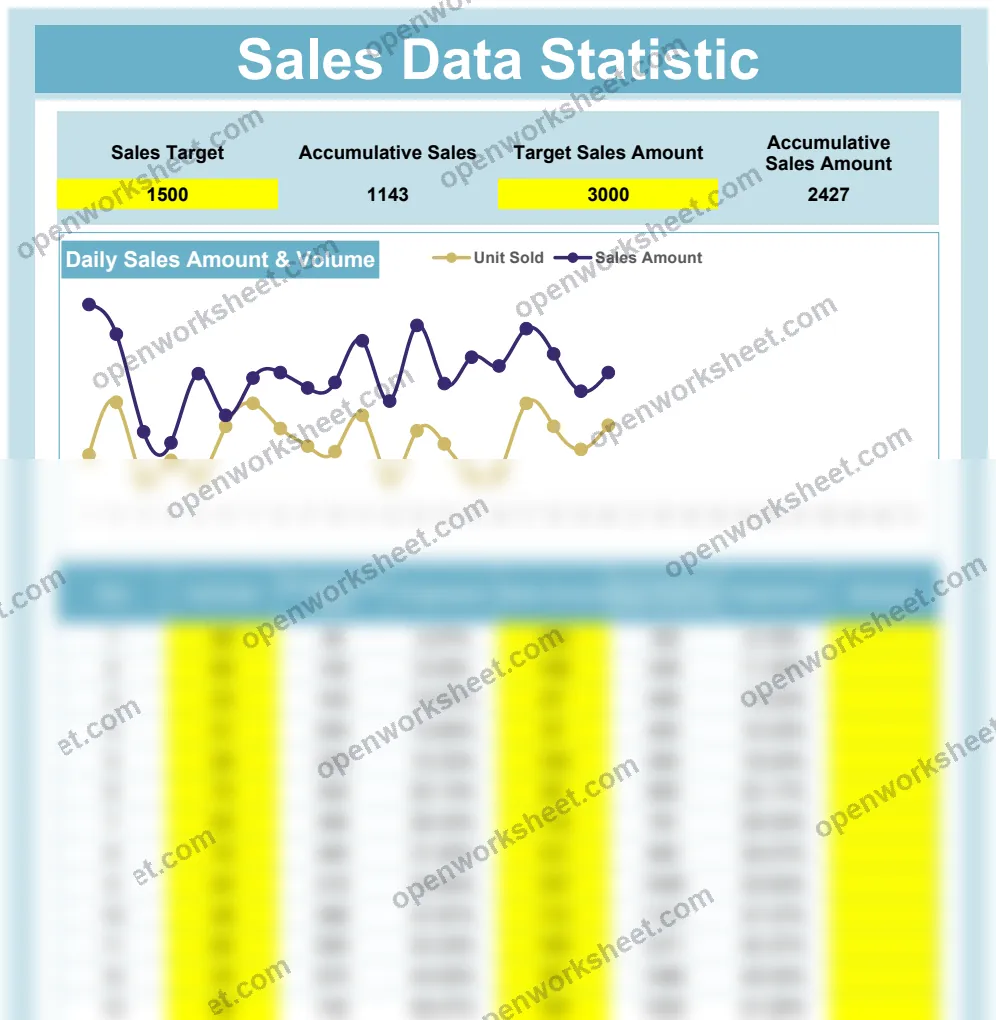
Sales Data Statistic
Track cumulative sales performance against targets with dynamic formulas and visual charts.
This template consolidates sales data with automatic accumulation calculations, comparing actual results against preset targets. It's designed for sales teams and managers who need quick visibility into performance metrics without manual data aggregation. The built-in charts and conditional formulas eliminate guesswork and keep everyone aligned on progress toward goals.
What's inside
- SUM formulas for automatic accumulation
- IF logic for conditional analysis
- Charts visualizing sales vs. targets
- Sales Target tracking
- Accumulative Sales calculation
Download this and everything else
.xlsx · 2 sheets · includes charts
$29$9once for thousands of templates. No subscription.
- Limited-time offer, normally $29
- One payment, no subscription
- 14-day refund
More in Sales & CRM
 Sales & CRM
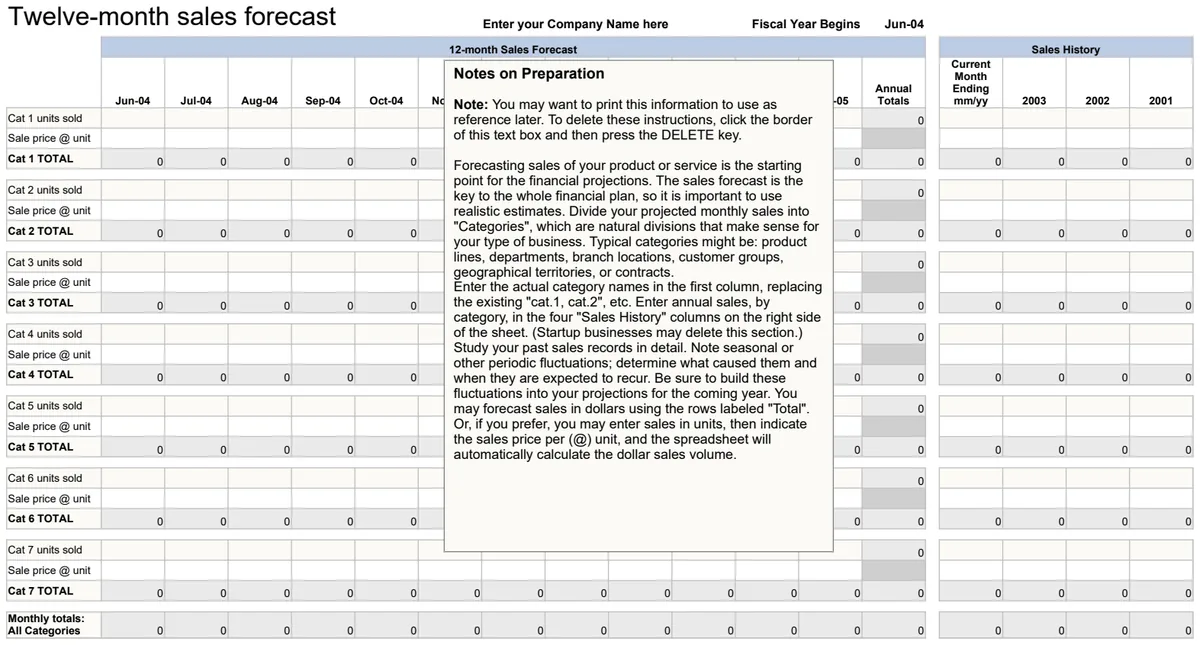
12 Month Sales Forecast
Project monthly revenue for the next 12 months with automated date calculations and totals.
- Automated month-by-month date generation
- Monthly sales amount entry fields
- Running total calculations across the year
 Sales & CRM
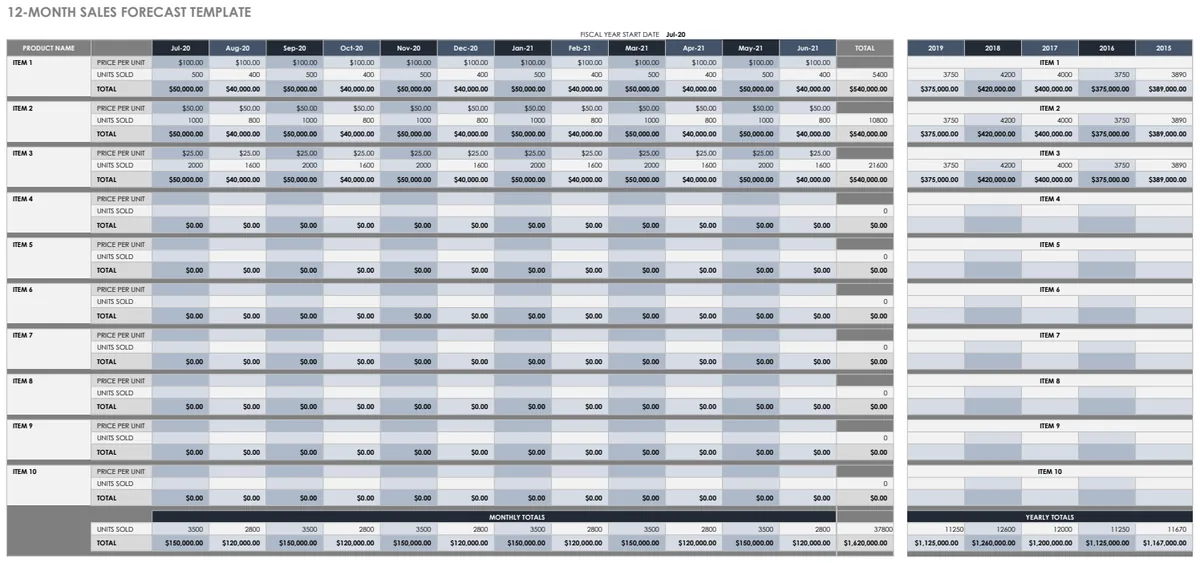
12 Month Sales Forecast Multiple Projects
Project-based sales forecasting across 12 months with pricing and unit tracking.
- 12-month rolling forecast view
- Multiple product/project lines
- Unit price and quantity tracking
 Sales & CRM
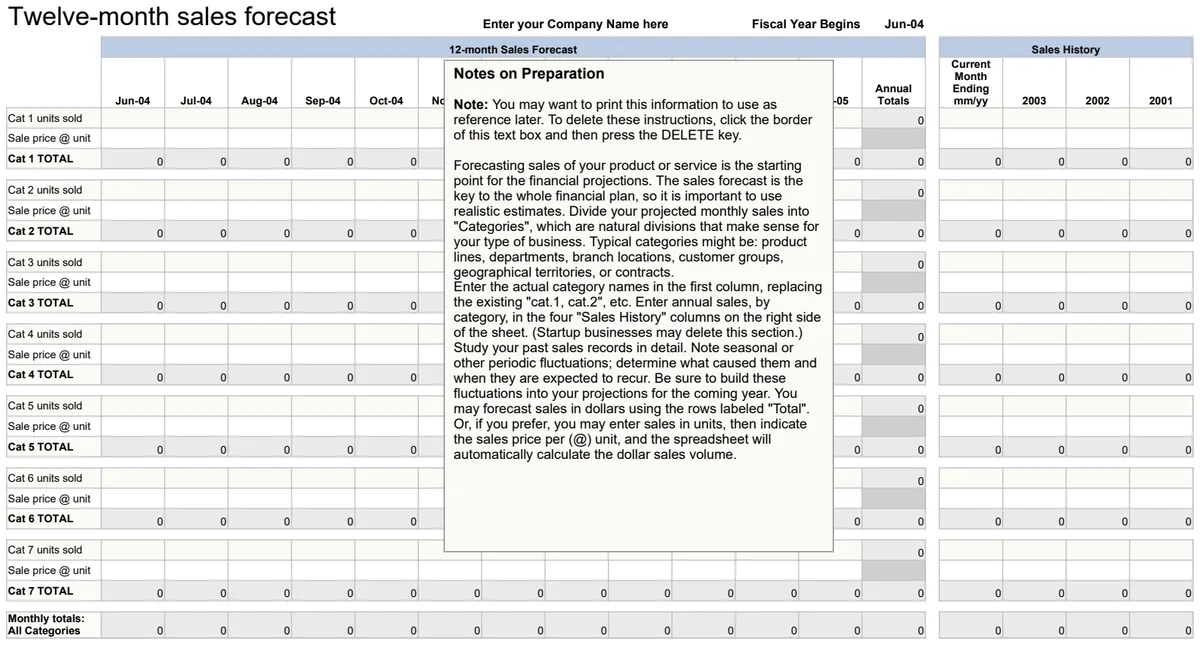
12-Month Sales Forecast
Project monthly revenue with automatic date calculations and rolling totals for annual planning.
- Automatic month-by-month date progression
- Summary totals for quarterly and annual sales
- Company name and fiscal year customization
 Sales & CRM
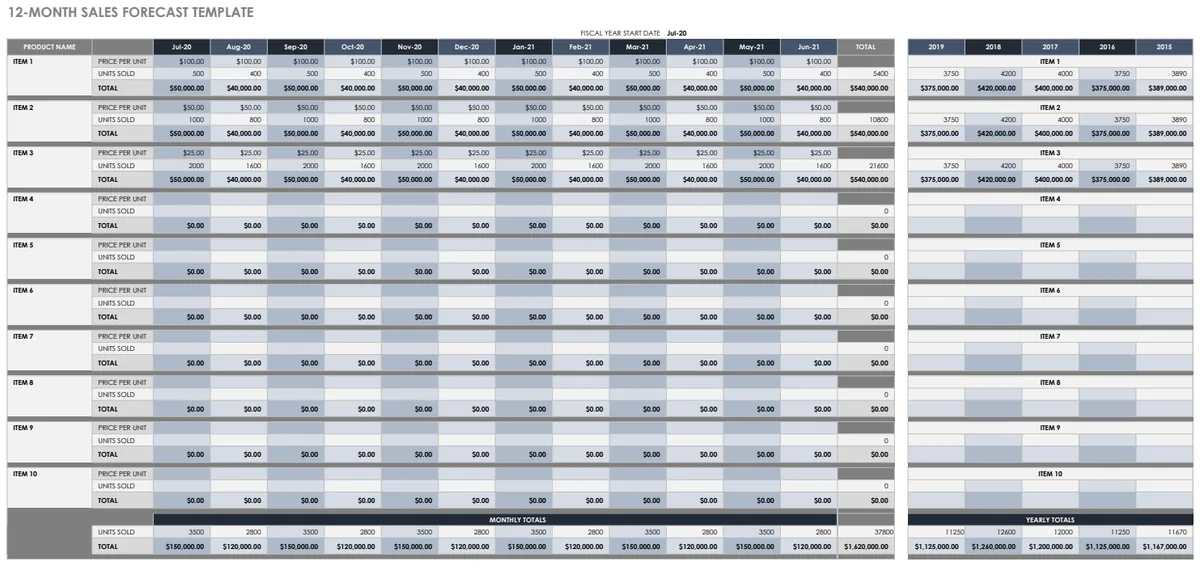
12-Month Sales Forecast Template
Project monthly revenue by product to plan inventory, staffing, and cash flow confidently.
- 12-month sales projection grid by product
- Automatic date calculation for each month
- Unit price and quantity tracking