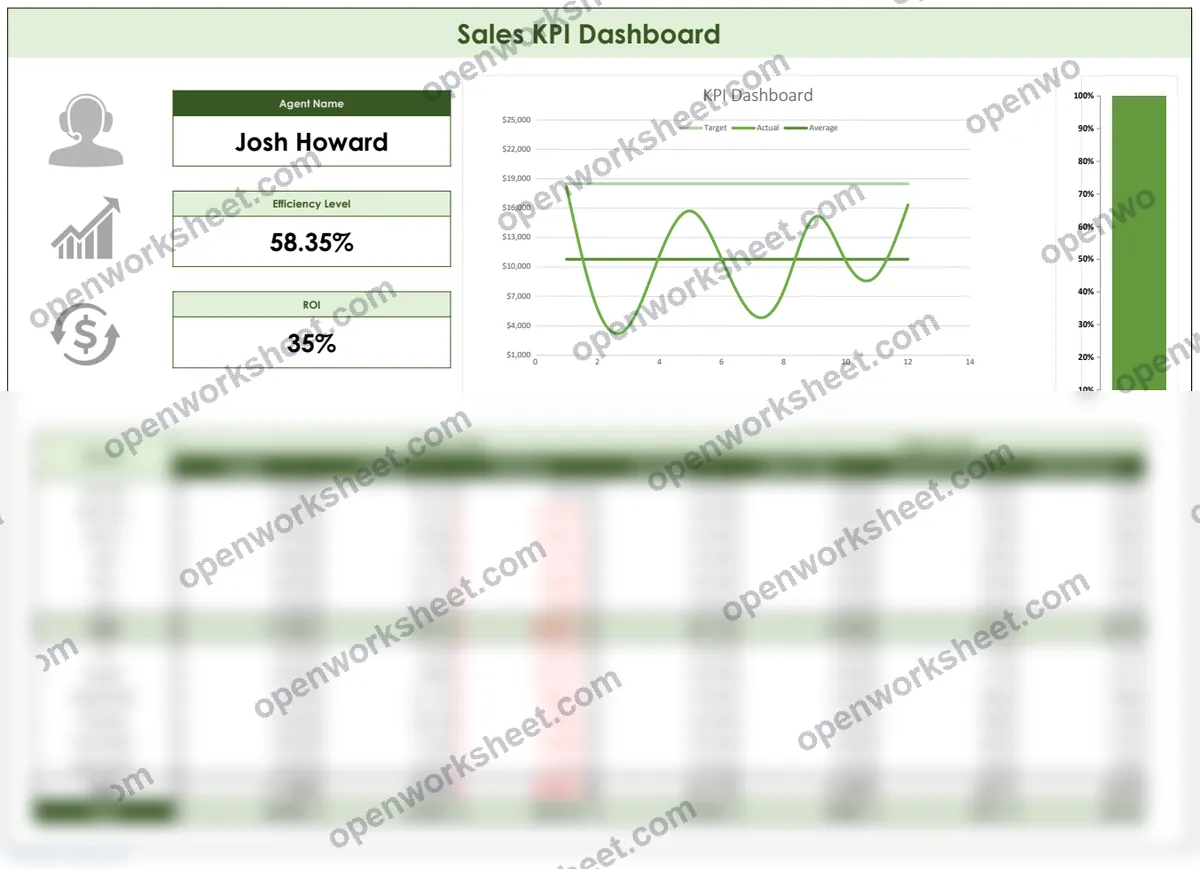
Sales KPI Dashboard
Track and visualize monthly sales performance metrics for individual sales agents with KPI calculations and trend analysis.
A comprehensive sales KPI dashboard designed to monitor sales agent performance across monthly periods. The template includes an input data sheet for recording sales figures by agent and month, a main dashboard for displaying key performance indicators, instructions for template usage, and reference data for income tax calculations. Features monthly sales tracking, agent-level performance metrics, visual charts for trend analysis, and automated calculations using AVERAGE, SUM, and VLOOKUP functions to identify top performers and sales trends.
What's inside
- Monthly sales data input
- Automated KPI calculations using SUM and AVERAGE
- VLOOKUP for data reference
- Visual charts for trend analysis
- Agent performance comparison
- Multi-month tracking
- Instructions guide
Download this template
.xlsx · 4 sheets · includes charts
$9/monthDownload up to 10 templates a month from a library of thousands. Cancel anytime.
- 10 downloads every month
- Cancel anytime
- 14-day refund
More in Sales & CRM
 Sales & CRM
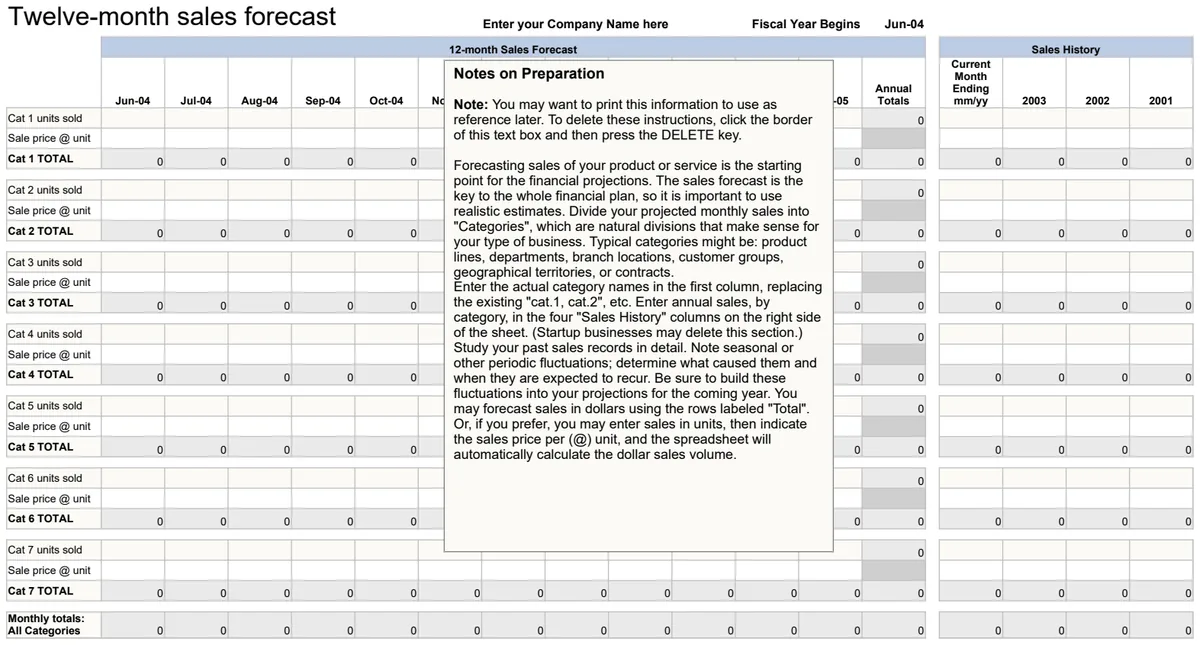
12 Month Sales Forecast
Project monthly revenue for the next 12 months with automated date calculations and totals.
- Automated month-by-month date generation
- Monthly sales amount entry fields
- Running total calculations across the year
 Sales & CRM
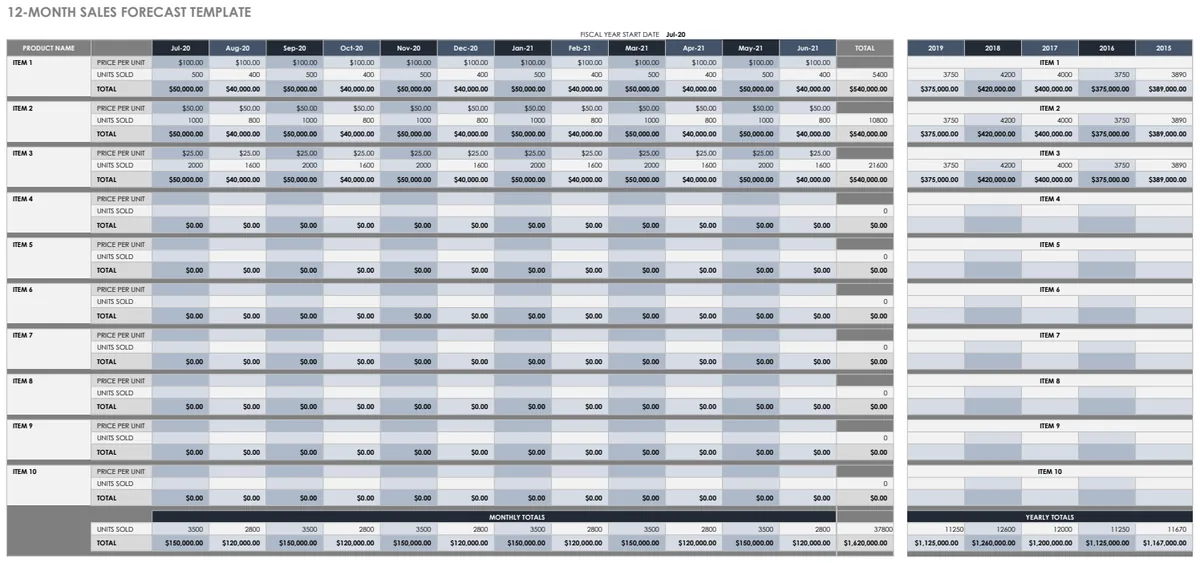
12 Month Sales Forecast Multiple Projects
Project-based sales forecasting across 12 months with pricing and unit tracking.
- 12-month rolling forecast view
- Multiple product/project lines
- Unit price and quantity tracking
 Sales & CRM
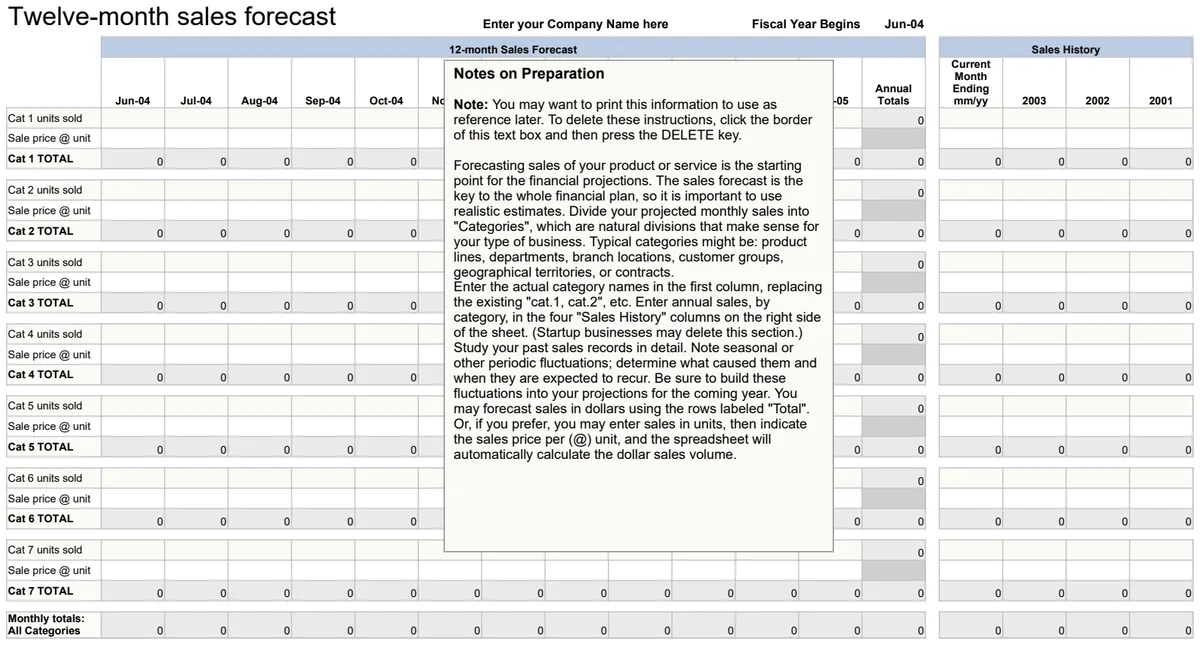
12-Month Sales Forecast
Project monthly revenue with automatic date calculations and rolling totals for annual planning.
- Automatic month-by-month date progression
- Summary totals for quarterly and annual sales
- Company name and fiscal year customization
 Sales & CRM
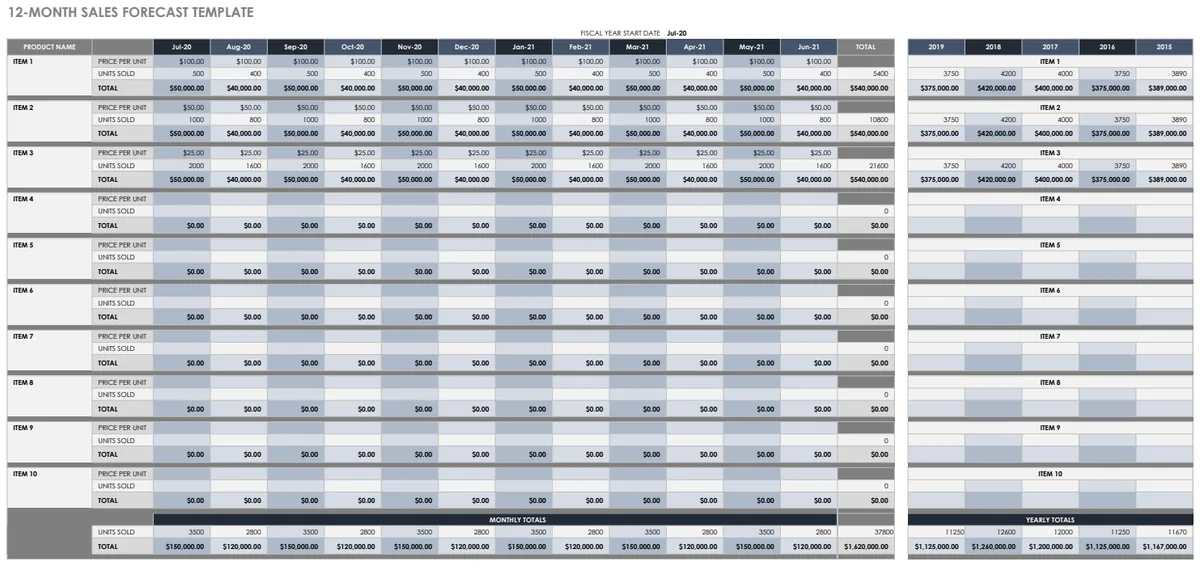
12-Month Sales Forecast Template
Project monthly revenue by product to plan inventory, staffing, and cash flow confidently.
- 12-month sales projection grid by product
- Automatic date calculation for each month
- Unit price and quantity tracking