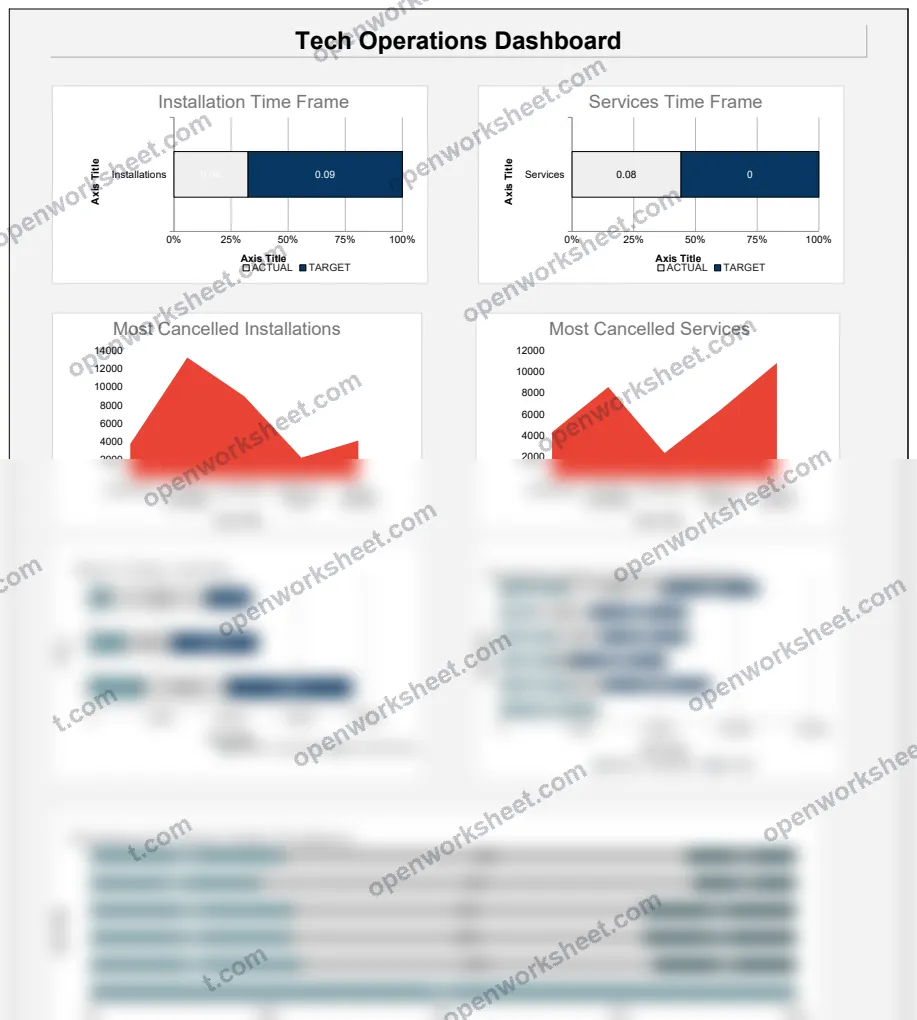
Tech Operations Dashboard Template
A comprehensive dashboard for monitoring and tracking technical operations performance metrics, projects, and timelines.
This Tech Operations Dashboard template provides a centralized view for tracking operational metrics, project progress, and performance targets. It includes data visualization through charts, actual vs. target comparisons, and a structured data entry system. The template is designed for technical teams and operations managers to monitor project timeframes, resource allocation, and key performance indicators. It features an organized data sheet for input and a dashboard sheet for visual analysis, making it easy to identify trends and manage operational efficiency.
What's inside
- Charts and visual analytics
- Actual vs. target comparison
- Project timeline tracking
- Data entry worksheet
- Performance dashboard view
- Exportable to Excel format
Download this template
.xlsx · 4 sheets · includes charts
$9/monthDownload up to 10 templates a month from a library of thousands. Cancel anytime.
- 10 downloads every month
- Cancel anytime
- 14-day refund
More in Project Management
 Project Management
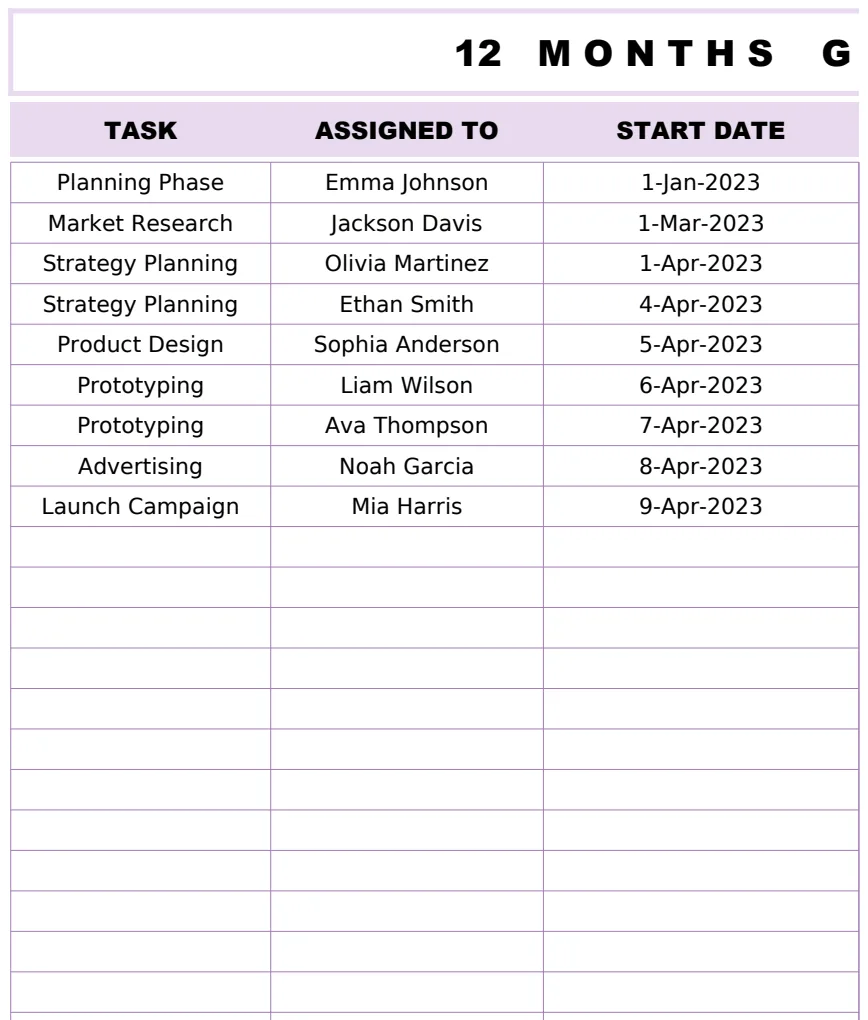
12 Months Gantt Chart Template
A professional 12-month project timeline visualization with task tracking, assignments, and duration calculations using Gantt chart methodology.
- Automatic duration calculation between start and end dates
- 12-month visual timeline representation
- Task assignment tracking
 Project Management
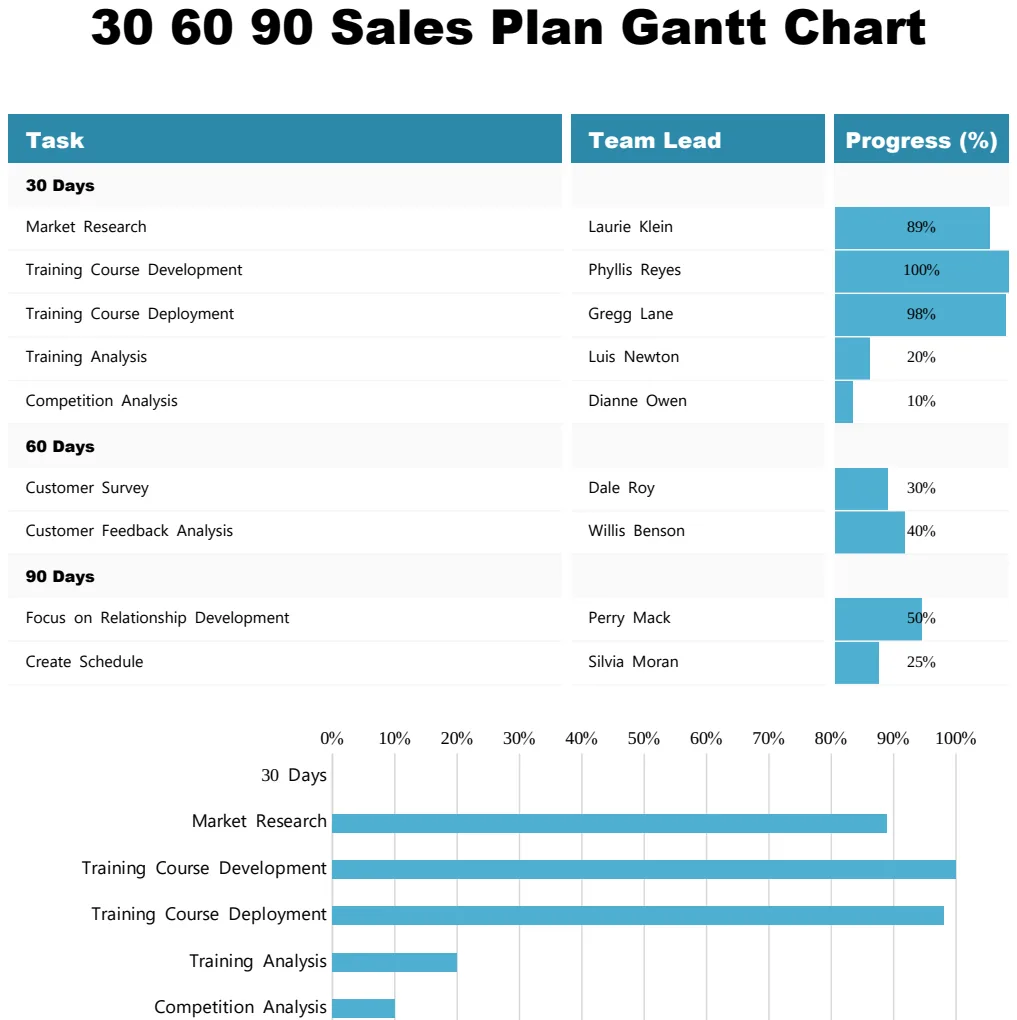
30 60 90 Sales Plan Gantt Chart
Visualize your 90-day sales plan with a Gantt chart showing tasks, team leads, and progress milestones.
- Task-by-task breakdown across 30, 60, and 90-day phases
- Team lead assignment per task
- Visual progress percentage tracking
 Project Management
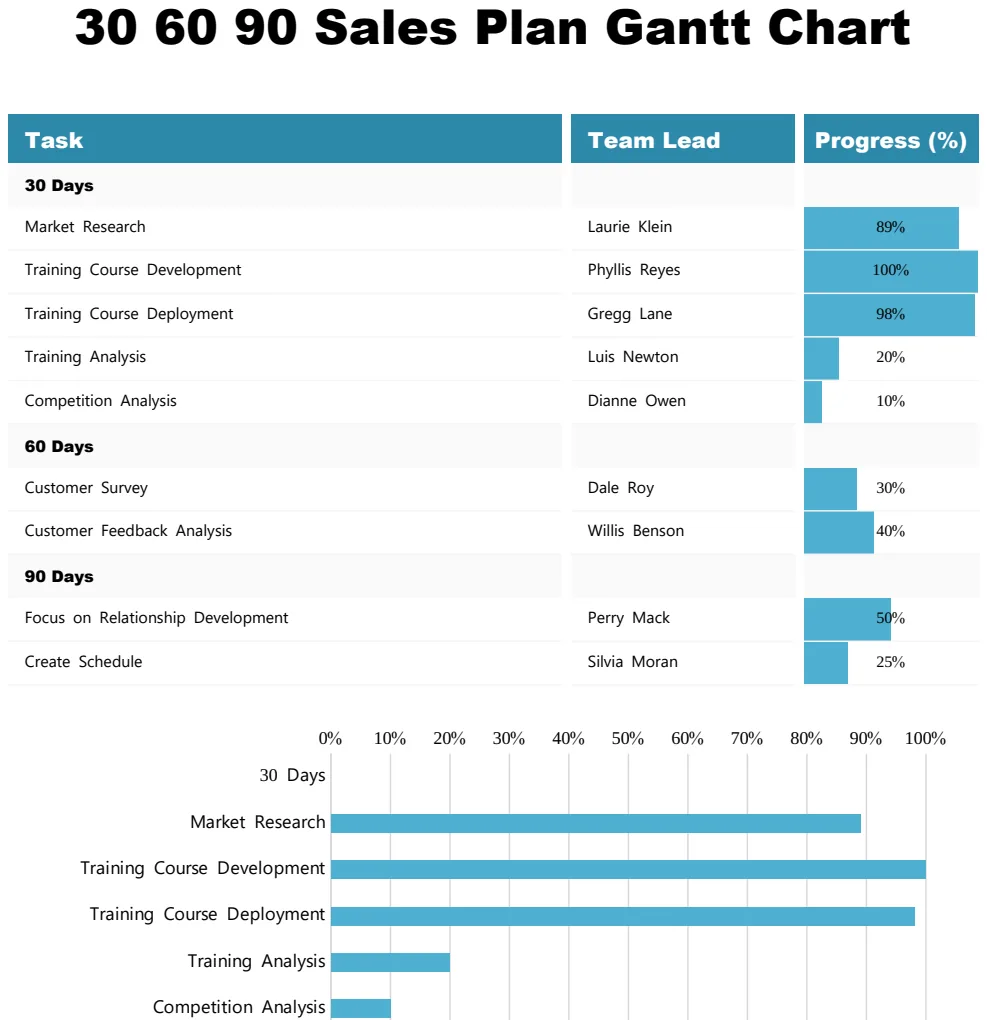
30 60 90 Sales Plan Gantt Chart
Track sales goals and milestones across 30, 60, and 90-day periods with visual progress tracking.
- Gantt timeline visualization
- Progress percentage tracking by task
- Team lead assignment column
 Project Management
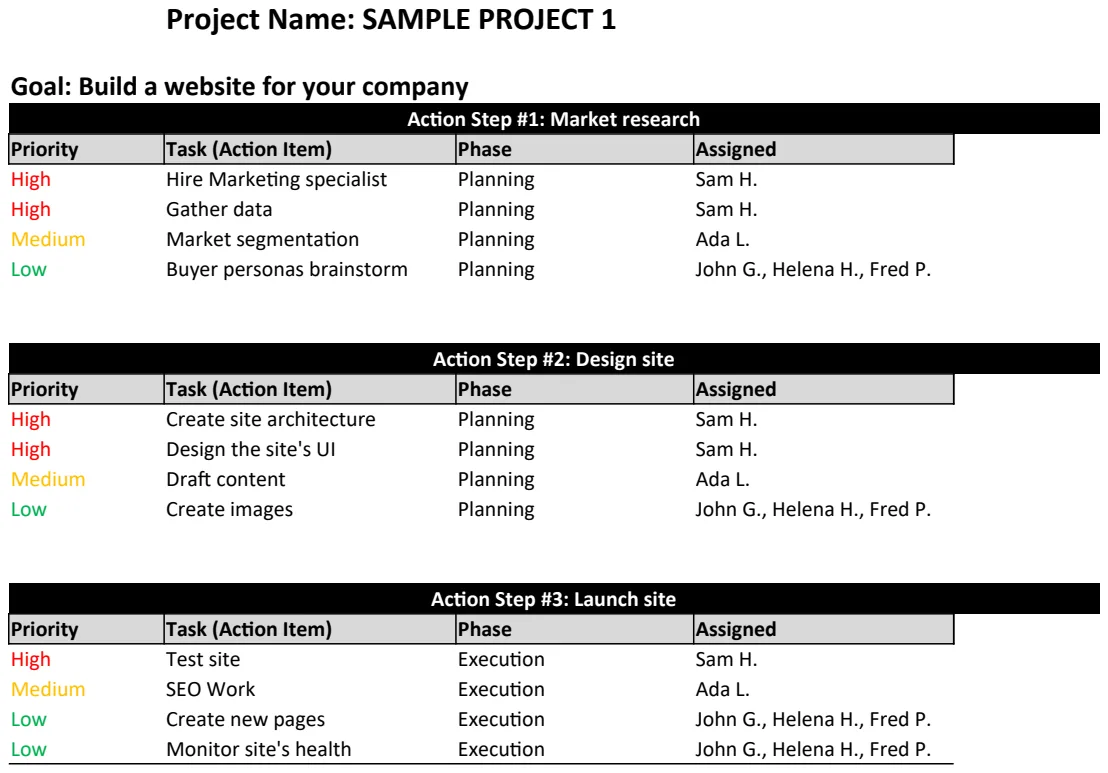
Action Plan Template
Structure project goals into actionable steps with timelines and ownership to drive execution.
- Project name and goal fields
- Action step numbering and description
- Timeline assignment per step