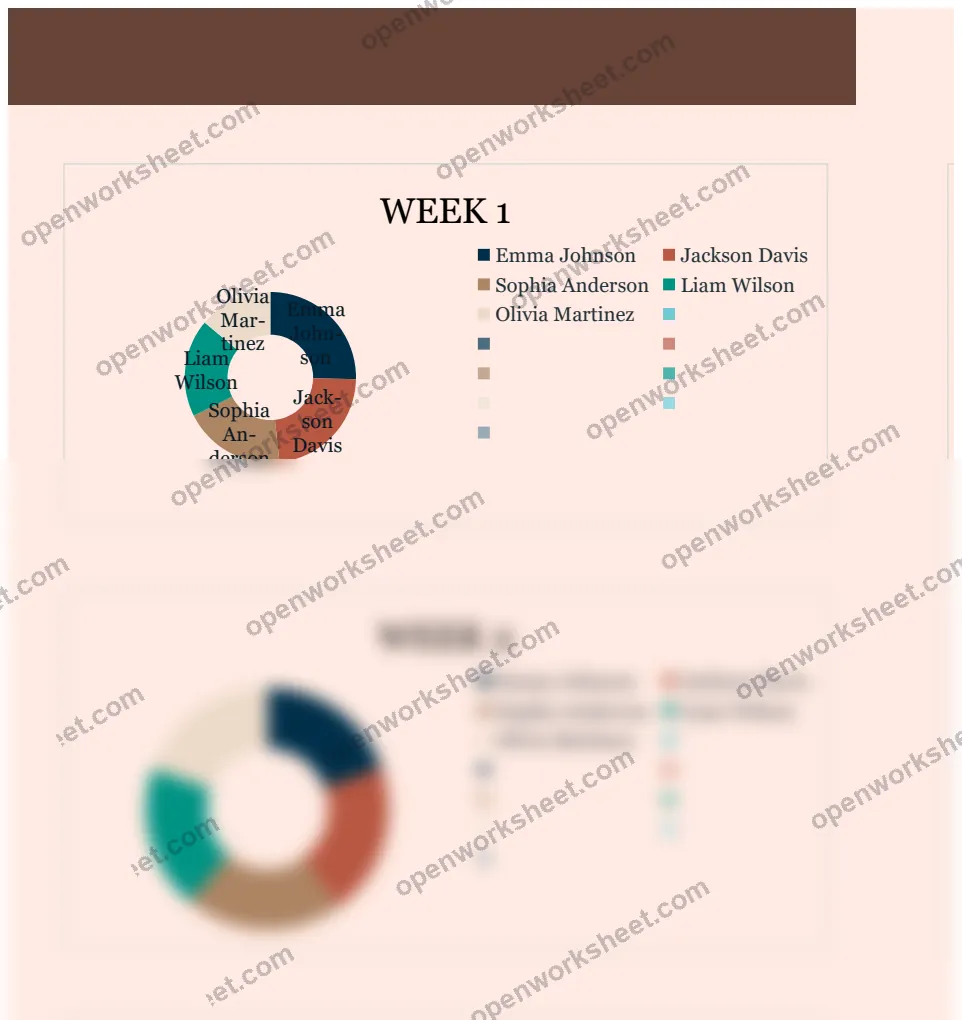
Weekly Chart Template
Track sales performance across weekdays with a structured weekly chart organizing data by sales agents and daily metrics.
A comprehensive weekly tracking template designed for sales teams to monitor daily performance metrics across a seven-day week. The template includes a main Weekly Chart sheet for visualization, a Data sheet containing weekly performance records (with samples for Week 1 and Week 6), and a Setup sheet for configuration. Each entry tracks sales agents and their daily sales figures, enabling quick performance analysis and trend identification across different agents and time periods. The template uses SUM functions to aggregate data and includes chart features for visual representation.
What's inside
- Weekly data organization by agent
- Daily sales tracking columns
- Multiple week data sheets
- SUM formulas for aggregation
- Chart visualization capability
- Setup configuration sheet
Download this template
.xlsx · 3 sheets · includes charts
$9/monthDownload up to 10 templates a month from a library of thousands. Cancel anytime.
- 10 downloads every month
- Cancel anytime
- 14-day refund
More in Sales & CRM
 Sales & CRM
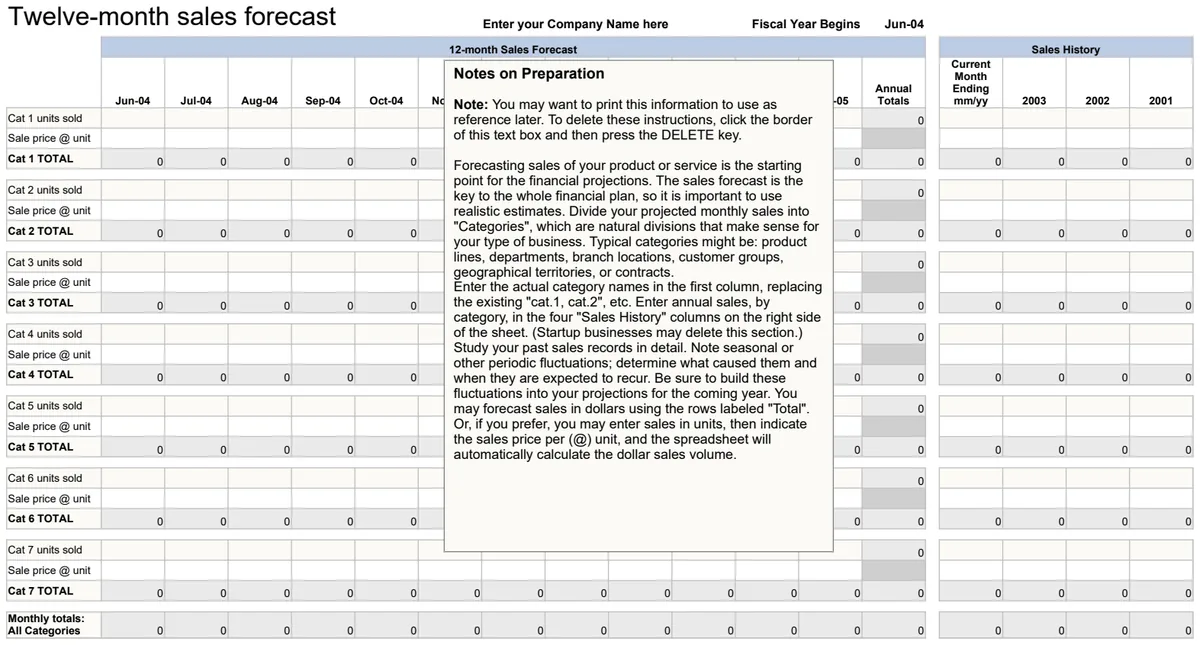
12 Month Sales Forecast
Project monthly revenue for the next 12 months with automated date calculations and totals.
- Automated month-by-month date generation
- Monthly sales amount entry fields
- Running total calculations across the year
 Sales & CRM
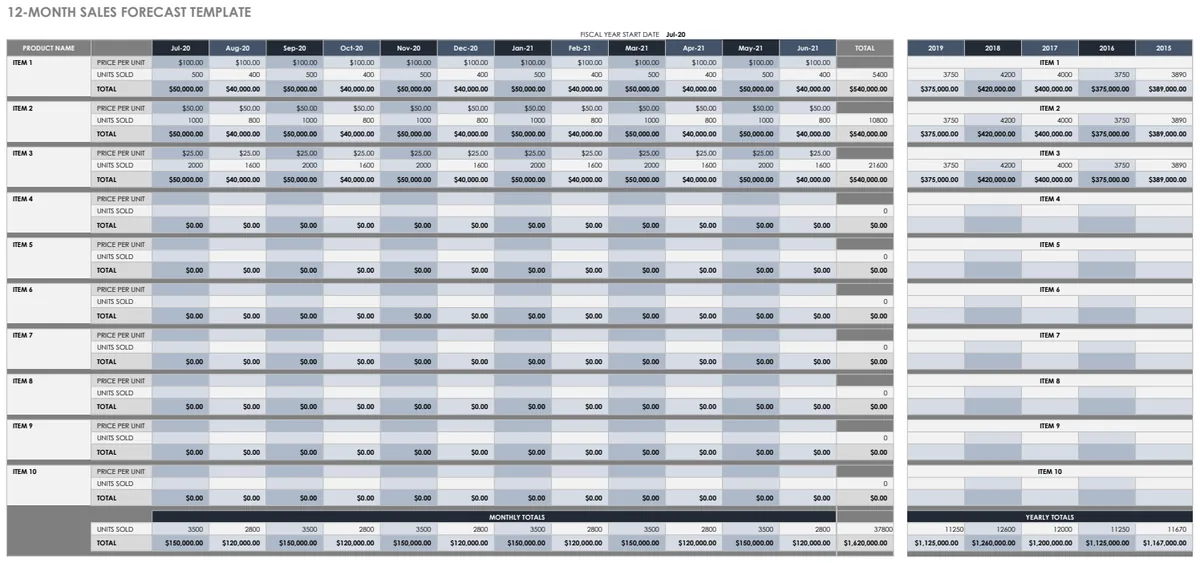
12 Month Sales Forecast Multiple Projects
Project-based sales forecasting across 12 months with pricing and unit tracking.
- 12-month rolling forecast view
- Multiple product/project lines
- Unit price and quantity tracking
 Sales & CRM
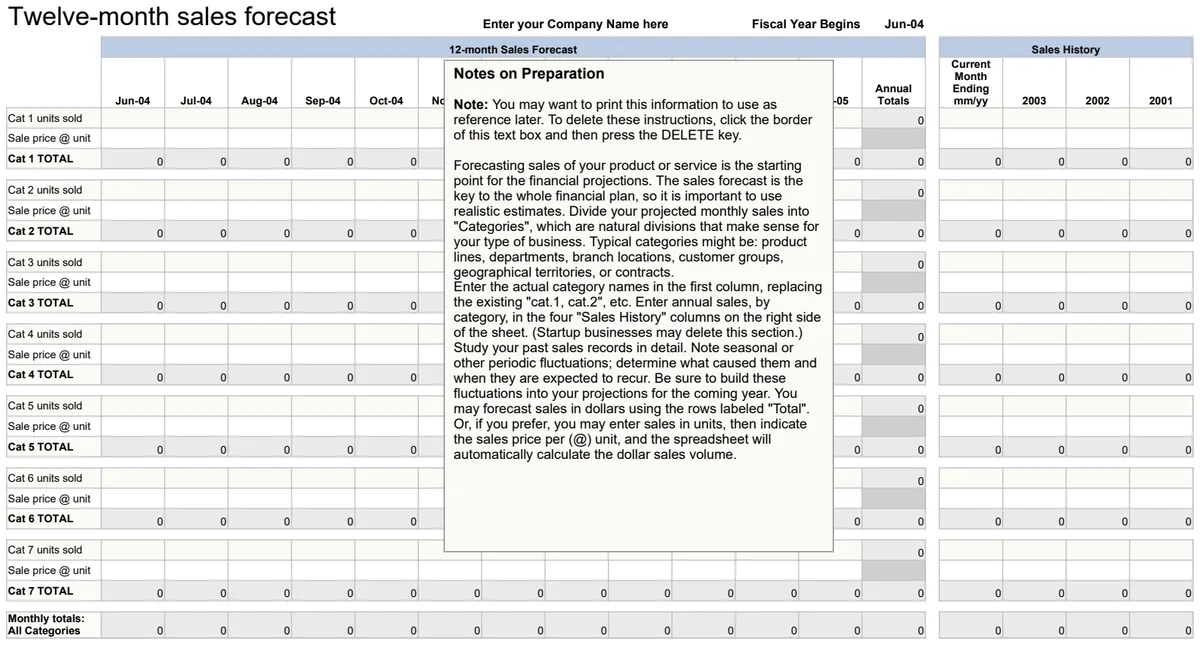
12-Month Sales Forecast
Project monthly revenue with automatic date calculations and rolling totals for annual planning.
- Automatic month-by-month date progression
- Summary totals for quarterly and annual sales
- Company name and fiscal year customization
 Sales & CRM
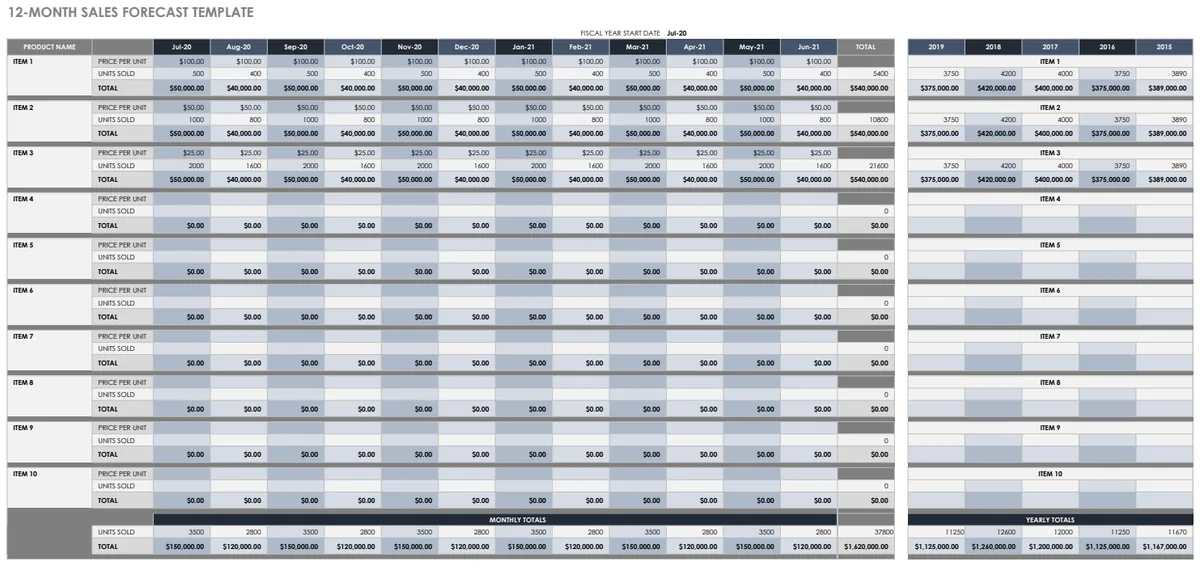
12-Month Sales Forecast Template
Project monthly revenue by product to plan inventory, staffing, and cash flow confidently.
- 12-month sales projection grid by product
- Automatic date calculation for each month
- Unit price and quantity tracking