5 free Google Sheets templates to boost your productivity
Find the best free Google Sheets templates 2026 has to offer for immediate utility and practical solutions.
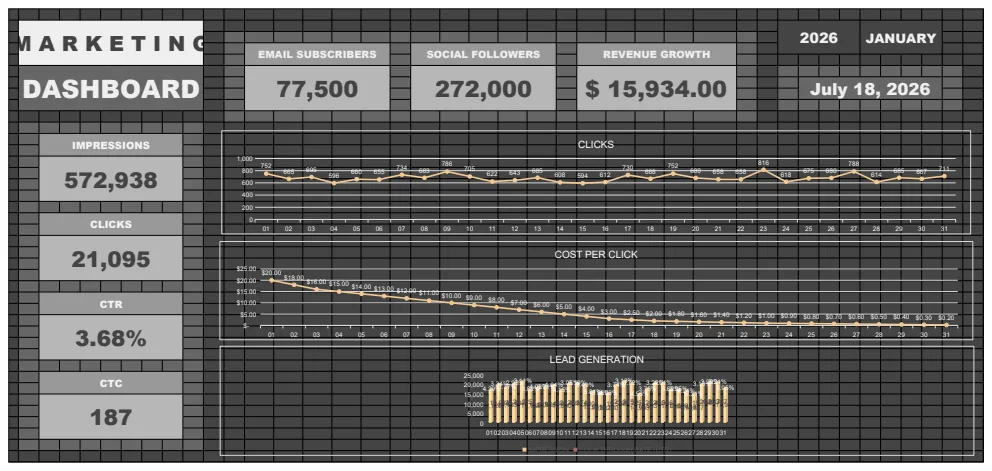
You'll have a clear, actionable marketing performance dashboard up and running, allowing you to see your campaign results at a glance, by the end of this guide. This is crucial for anyone sifting through the noise to find the best free Google Sheets templates 2026 has to offer, especially when looking for immediate utility.
Many people start by searching for the "best free Google Sheets templates 2026" and end up with a download that looks good but doesn't actually solve their immediate problem. The real value comes from templates that are not just free, but also deeply functional and adaptable to your specific needs right out of the box. We'll focus on practical applications that save you time and deliver insights, rather than just listing visually appealing but ultimately hollow options.
Building Your Marketing Performance Dashboard
A marketing dashboard is essential for tracking key performance indicators (KPIs). Imagine having a single view that shows you how your campaigns are performing across different channels, from social media impressions to website traffic and conversion rates. This isn't just about looking at numbers; it's about understanding trends, identifying what's working, and knowing where to allocate your budget more effectively. With a well-structured template, you can automate much of the data aggregation, freeing you up to focus on strategy.
For instance, you might be tracking impressions, clicks, click-through rates (CTR), cost per click (CPC), and ultimately, conversions. A good template will have sections for each of these, often with visual elements like charts and graphs to make the data digestible. You'll want to be able to input data from various sources, whether it's manually entered or pulled via simple copy-paste.
Essential Metrics to Track
When setting up your marketing dashboard, certain metrics are non-negotiable. These form the backbone of understanding campaign success.
- Impressions: The total number of times your content or ad was displayed.
- Clicks: The number of times users clicked on your content or ad.
- Click-Through Rate (CTR): The percentage of impressions that resulted in a click (Clicks / Impressions). This tells you how engaging your content is.
- Cost Per Click (CPC): The average amount you pay for each click on your ad.
- Conversions: The number of desired actions taken by users (e.g., purchases, sign-ups, downloads).
- Conversion Rate: The percentage of clicks that resulted in a conversion (Conversions / Clicks). This is a key indicator of campaign effectiveness.
- Cost Per Acquisition (CPA): The average cost to acquire a customer or achieve a conversion.
You'll want a template that clearly displays these, ideally with options to filter by date range, campaign, or channel. This granular view is what helps you make informed decisions.
Setting Up Your Data Input Sheets
The foundation of any effective dashboard is clean, organized data. Most templates will have a dedicated sheet or section for data input. This is where you'll either manually enter your campaign performance figures or, if you're more advanced, set up connections to pull data from other sources.
For manual entry, the key is consistency. Use clear column headers. For a marketing dashboard, these might include:
- Date: The date the data was recorded.
- Campaign Name: The specific name of the marketing campaign.
- Channel: The platform where the campaign ran (e.g., Facebook Ads, Google Ads, Email, Organic Social).
- Impressions: Number of impressions for that period.
- Clicks: Number of clicks.
- Spend: The amount of money spent on that campaign/channel.
- Conversions: Number of conversions.
A common mistake here is inconsistent naming conventions for campaigns or channels. If you write "Facebook Ads" one day and "FB Ads" the next, your reporting will become fractured. Standardize these terms from the start.
Leveraging Formulas for Automated Analysis
The real power of a Google Sheet template comes from its formulas. These are what transform raw data into actionable insights. Even a basic template will use formulas for calculations like CTR, conversion rate, and CPA.
For example, to calculate CTR in cell D2, assuming your 'Clicks' are in column B and 'Impressions' are in column C, you might use the formula: =IFERROR(B2/C2, 0). The IFERROR function is crucial here; it prevents a #DIV/0! error if you have zero impressions, displaying a 0 instead.
To calculate the conversion rate, if 'Conversions' are in column E, you might use: =IFERROR(E2/B2, 0).
Calculating CPA involves your total spend. If 'Spend' is in column F, the formula would be: =IFERROR(F2/E2, 0).
When evaluating the best free Google Sheets templates 2026, look for templates that already have these calculations built-in and that use clear, understandable formulas. Modifying them later will be much easier.
Visualizing Your Data with Charts and Graphs
Numbers alone can be overwhelming. Visualizations turn data into stories. Your marketing dashboard should ideally include charts that illustrate trends over time or comparisons between different campaigns and channels.
Common chart types include:
- Line Charts: Excellent for showing trends over time, such as daily or weekly impressions or conversions.
- Bar Charts: Useful for comparing performance across different campaigns or channels side-by-side.
- Pie Charts: Can be used to show the proportion of spend or conversions by channel, though they are often less effective for precise comparisons than bar charts.
A well-designed template will automatically update these charts as you input new data. This visual feedback loop is invaluable for quickly grasping performance. If you're looking for a template that provides this immediate visual feedback, consider exploring options like the Marketing Dashboard Template, which is specifically designed to aggregate and visualize key campaign metrics.
Common Mistakes to Avoid
When using free templates, or even when building your own, several pitfalls can undermine your efforts. Being aware of them can save you a lot of headaches.
- Inconsistent Data Entry: As mentioned, using different names for the same campaign or channel will break your analysis.
- Over-reliance on Vanity Metrics: Focusing too much on impressions without considering conversions can be misleading. High impressions are good, but only if they lead to desired outcomes.
- Ignoring CPA or ROI: Understanding how much you're spending to acquire a customer is critical for profitability.
- Lack of Data Granularity: Not breaking down performance by campaign, ad set, or keyword can hide significant issues or opportunities.
- Outdated Data: Failing to update your spreadsheet regularly means your insights will be based on old information, leading to poor decisions.
- Complex Formulas You Don't Understand: While advanced formulas can be powerful, if you don't know how they work, troubleshooting or adapting them becomes impossible.
Many users searching for the "best free Google Sheets templates 2026" might download something that looks impressive but doesn't have these fundamental elements built in, or worse, has them but uses overly complex, undocumented formulas.
Adapting Templates for Specific Needs
While templates provide a great starting point, they rarely fit perfectly without some adjustment. You might need to add columns for new metrics, adjust formula references if you change the sheet layout, or modify chart ranges.
For example, if your primary goal is lead generation, you might want to add columns for 'Leads Generated' and calculate 'Cost Per Lead' instead of CPA. This involves modifying the input sheet and updating or adding formulas. If you're using a template for financial tracking, you might need to add specific expense categories or income sources relevant to your business. The key is to understand the existing structure before you start making changes. A template like the Marketing Dashboard Template often includes clear labels and well-structured sections, making these adaptations more straightforward.
Customizing Formulas
If you need to change a formula, like adjusting the IFERROR value from 0 to something else, or if you're adding a new calculated field, you’ll be editing cells directly. For instance, if you want to track Return on Ad Spend (ROAS) and you have a 'Revenue' column (let's say in column G), your ROAS formula might look like =IFERROR(G2/F2, 0). Always double-check that your cell references (B2, C2, F2, G2, etc.) correctly point to the data on your input sheet.
Adding New Visualizations
To add a new chart, select the data range you want to visualize, go to Insert > Chart in Google Sheets, and choose your preferred chart type. You can then customize its appearance, labels, and axes to match your existing dashboard. Ensure the chart's data range is set up to automatically expand or is manually updated as you add more data.
Finding More Useful Templates
If you've explored the best free Google Sheets templates 2026 has to offer and still need something more specific, consider looking for templates that cater to particular industries or functions. Many creators offer specialized templates for project management, budgeting, inventory tracking, and more. For example, a Sales Pipeline Tracker could be vital if your focus is on managing customer leads through the sales process. The library at OpenWorksheet offers a range of such tools, often available for a one-time fee that provides access to all downloads.
What if a Template Uses Macros?
Some free templates might include Google Apps Script macros for added functionality. While these can be powerful, they also introduce security considerations. Google Sheets will usually prompt you to grant permission for scripts to run. Be cautious and only grant permission if you trust the source of the template. If you're not comfortable with macros, look for templates that rely solely on built-in formulas and functions.
How Often Should I Update My Dashboard?
The frequency depends on your data's volatility and your reporting needs. For marketing campaigns with daily ad spend and performance fluctuations, updating daily or every other day is ideal. For slower-moving data, like monthly sales figures, a weekly or bi-weekly update might suffice. The key is to establish a rhythm that provides timely insights without becoming a burdensome chore.
Can I Share My Template with My Team?
Yes, Google Sheets makes sharing easy. You can share your entire spreadsheet by clicking the 'Share' button in the top right corner. You can grant different levels of access: 'Viewer' (can only see), 'Commenter' (can add comments), or 'Editor' (can make changes). This is perfect for collaborative environments where everyone needs to be on the same page regarding performance data.