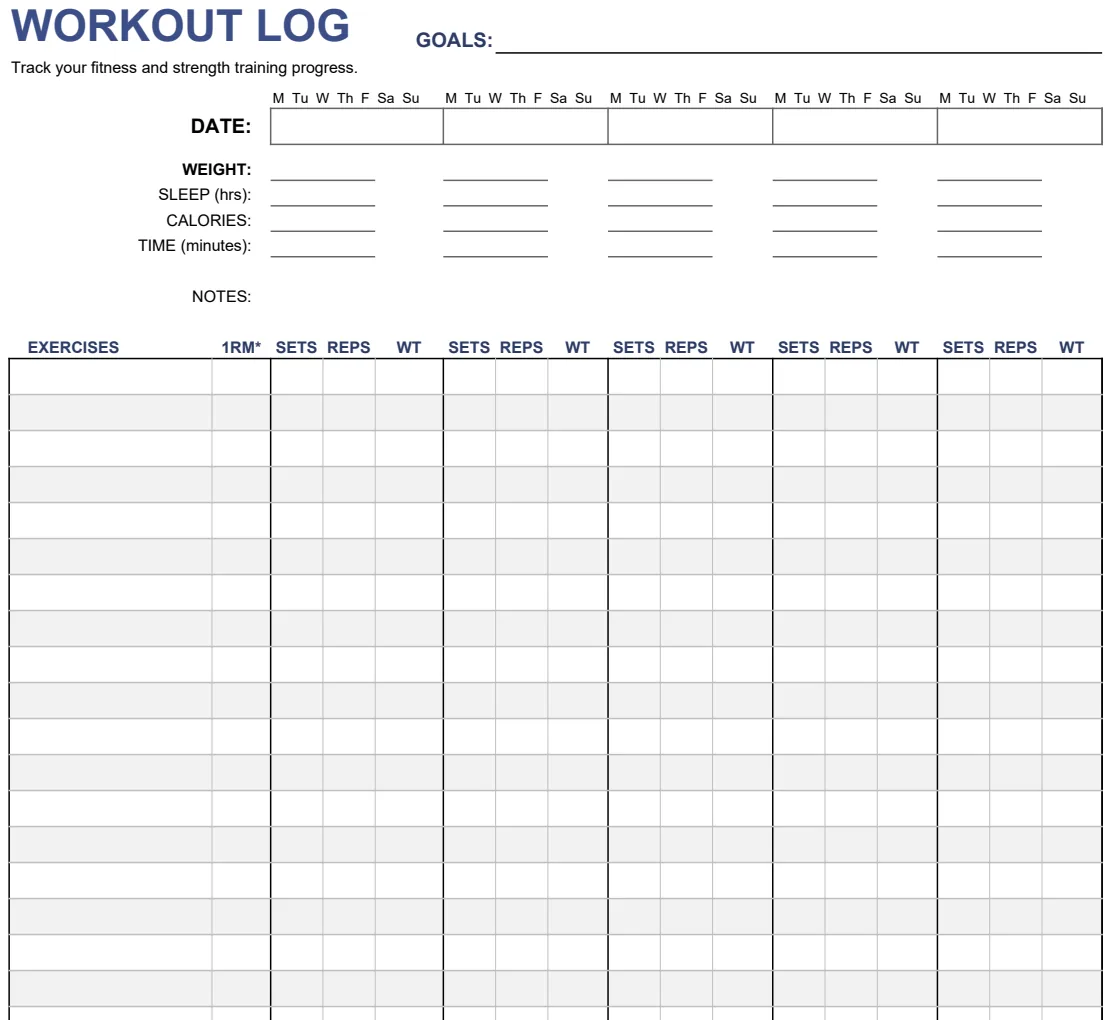
Excel running log template for tracking your miles
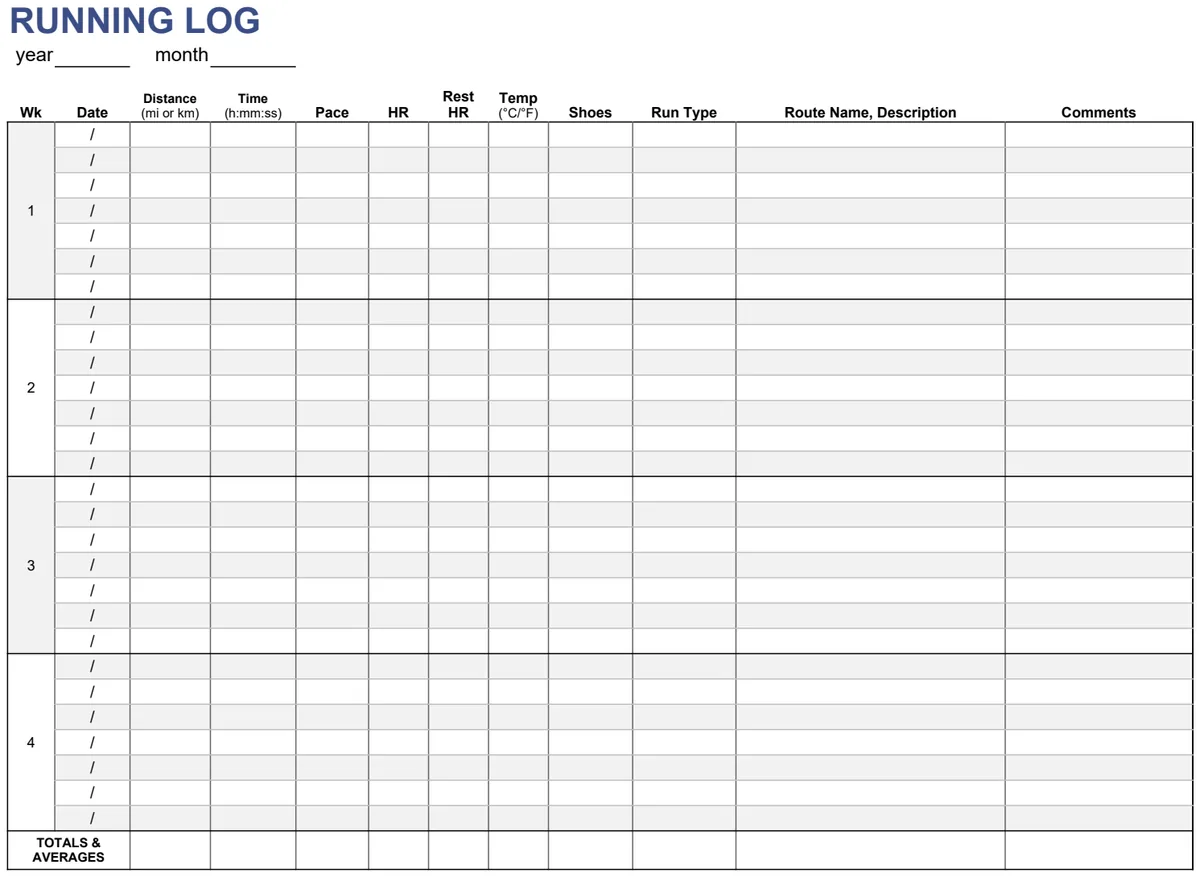
Stop using basic templates. This guide helps you build a flexible running log spreadsheet in Excel to track what truly matters.
Many pre-built running log spreadsheet template Excel options on the internet are too basic, forcing you to shoehorn your specific training nuances into inflexible columns. You’ve probably seen them: just date, distance, and time. But what about your warm-up, cool-down, or the specific drills you ran? Without a flexible structure, you risk incomplete data, which hinders your ability to analyze performance, prevent injury, and truly understand your training progression.
This is why building or customizing your own spreadsheet can be so powerful. You can tailor it to capture precisely the metrics that matter to your running goals. Whether you’re training for your first 5k or aiming for a marathon PR, a well-designed log is your most valuable training partner.
Why a Custom Running Log Matters
Think about the data points that truly inform your training. Is it just miles and minutes? Probably not. You might want to track:
- Run Type: Easy run, tempo, interval, long run, recovery run, cross-training.
- Location: Trail, road, track, treadmill.
- Effort Level: Perceived exertion on a scale of 1-10.
- Weather Conditions: Temperature, precipitation, wind.
- Specific Workout Details: Intervals, reps, sets, recovery times.
- How You Felt: Energy levels, muscle soreness, sleep quality.
- Heart Rate Data: Average and max HR for the run.
- Pace: Overall pace, split paces, interval paces.
- Distance and Duration: The core metrics.
- Notes: Any other observations or personal reflections.
A generic template often fails to accommodate this depth. You end up with either too many empty columns or a complex system of codes you have to decipher later. A custom setup ensures the data you collect is actionable.
Building Your Core Running Log Spreadsheet
Let's lay out the foundation for a robust running log. We’ll use a standard Excel or Google Sheets structure.
Start with these essential columns in Sheet1, which we’ll call "Training Log":
- Date: Format this column as "Date".
- Day of Week: You can use a formula like
=TEXT(A2,"ddd")assuming your Date is in A2. This is helpful for spotting patterns, like slower runs on Mondays. - Run Type: Use Data Validation (Data > Data Validation) to create a dropdown list. Common options: Easy, Tempo, Interval, Long Run, Recovery, Race, Cross-Train.
- Distance (km/mi): Choose your preferred unit and stick to it.
- Duration: Format this as Time (e.g.,
0:45:30for 45 minutes and 30 seconds). - Pace (min/km or min/mi): This is a calculated field. If Distance is in D2 and Duration is in E2, the formula would be
=D2/E2. Format this as a Number with two decimal places. - Average HR: For heart rate data.
- Max HR: Maximum heart rate during the session.
- Perceived Exertion (RPE): A simple number from 1 (very easy) to 10 (maximal effort).
- Weather: A brief text description (e.g., Sunny, 15°C, Windy).
- Notes: For any miscellaneous details.
Adding Advanced Tracking Elements
Once you have the basics, you can expand. Consider adding these as separate columns or even a linked sheet for more complex workouts.
- Warm-up Duration: Track time spent on warm-up.
- Cool-down Duration: Track time spent on cool-down.
- Workout Details: This is crucial for intervals. You might log sets, reps, rest periods, or specific drill names. For example, you could have a column for "Intervals" and list
8 x 400m @ 5k pace w/ 90s rest. - Feeling/Energy: A simple rating (1-5) or a few keywords.
- Sleep Quality: Rating (1-5) from the night before.
- Elevation Gain: Especially important for trail runners.
If you find yourself tracking multiple similar activities, like running and walking, you might appreciate a template that handles this complexity. The Running & Walking Log Tracker is designed to sort and filter different activity types efficiently.
Formulas to Enhance Your Log
Beyond the basic pace calculation, formulas can automate analysis.
- 01Total Weekly/Monthly Distance: On a separate sheet, say "Summary," you can use
SUMIFS. If your "Training Log" sheet has dates in column A and distances in column D:
- For weekly distance (assuming Week Starting Date in B1 of Summary sheet):
=SUMIFS('Training Log'!D:D, 'Training Log'!A:A, ">="&B1, 'Training Log'!A:A, "<"&B1+7) - For monthly distance (assuming Month Start Date in C1 of Summary sheet):
=SUMIFS('Training Log'!D:D, 'Training Log'!A:A, ">="&C1, 'Training Log'!A:A, "<"&EOMONTH(C1,0)+1)
- 02Average Pace by Run Type: Use
AVERAGEIFS. If Run Type is in C, Pace is in G, and you want the average pace for "Easy" runs in cell D2 of your Summary sheet:=AVERAGEIFS('Training Log'!G:G, 'Training Log'!C:C, "Easy").
- 03Counting Run Types: Use
COUNTIF. In cell E2 of your Summary sheet, to count "Long Runs":=COUNTIF('Training Log'!C:C, "Long Run").
Visualizing Your Progress with Charts
Spreadsheets are powerful for analysis, but charts bring data to life.
- Distance Over Time: A line chart showing your total weekly or monthly distance plotted against time can reveal trends in your mileage.
- Pace Trends: Plot your average pace for specific run types (like "Easy" or "Tempo") over time. Seeing your pace decrease for the same effort level is a strong indicator of fitness gains.
- Frequency of Run Types: A pie chart or bar chart showing the proportion of different run types in your training week can highlight if your training mix is balanced.
To create these: Select the data you want to chart (e.g., Date column and Distance column), then go to Insert > Chart. Excel and Sheets will suggest chart types, or you can select one manually.
Conditional Formatting for Quick Insights
Conditional formatting can immediately highlight important data points.
- Highlighting High/Low Pace: Select your Pace column (column G). Go to Conditional Formatting > Highlight Cells Rules > Less Than. Enter a target pace (e.g.,
4:30) and choose a green fill to highlight runs that were faster than your goal pace. You can also use "Greater Than" with a red fill for paces that are too slow. - Identifying High RPE: Select your RPE column (column J). Use Conditional Formatting > Color Scales. A green-to-red scale will visually show you which runs felt harder.
- Flagging Inconsistent Runs: You might set up a rule to flag runs where your average HR was unusually high for a given pace, or vice-versa, potentially indicating fatigue or illness.
Common Mistakes to Avoid
- Inconsistent Units: Mixing kilometers and miles, or minutes/km and minutes/mile within the same log, will invalidate your pace calculations and analysis. Pick one and stick to it.
- Not Logging Consistently: A few missed days can break a trend line. Try to log runs immediately after finishing them.
- Overly Complex Setup: While depth is good, if your spreadsheet has 50 columns and requires hours to fill out, you're less likely to use it. Start simple and add complexity as needed.
- Ignoring the "Notes" Section: This is where qualitative data lives. You might forget why a particular run felt easy or hard if you don't jot down a quick note.
- Not Backing Up Your Data: Treat your log as critical data. Save it regularly, and consider using cloud storage like OneDrive or Google Drive.
Frequently Asked Questions
Can I use this running log for cycling too?
Yes, you can adapt it. If you track cycling, you'd likely adjust metrics like "pace" to "speed" and potentially add columns for "elevation gain" or "power output." For dedicated cycling tracking, a tool like the Cycling Mileage Tracker might offer more specialized fields.
How do I handle race days?
Race days are a type of run. Ensure you have a "Run Type" option for "Race" and log the official race distance, your finish time, and perhaps your average heart rate and pace from the event. You can also use the Notes section to record your finishing position or other race-specific details.
What if I want to track my strength training or other fitness activities?
You can add more rows to your "Training Log" sheet and use the "Run Type" dropdown to include options like "Strength Training," "Yoga," or "Swimming." Alternatively, you could create entirely separate sheets or use dedicated templates for those activities. For general expense tracking, a template like the Credit Card Usage Log can help manage related costs.
Is there a way to automatically calculate my weekly mileage total?
Absolutely. Using formulas like SUMIFS on a separate "Summary" sheet, as described earlier, allows you to automatically sum up your total distance for any given week or month based on the dates logged. This saves you from manually adding up numbers each week.