Excel vs. Google Sheets: Your free weekly budget
Learn how to create a functional Excel spreadsheet to track your spending and manage your personal finances effectively.
By the end of this, you'll have a functional Excel spreadsheet ready to track your spending day-by-day, week-by-week, showing you exactly where your money is going. This isn't just about recording transactions; it's about building a clear picture of your cash flow that you can adjust in real-time. If you're searching for a weekly budget template Excel free, you're likely looking for a straightforward way to manage your personal finances without complex software or recurring fees.
Understanding your weekly spending is a powerful first step toward taking control of your money. Many people find that breaking down their finances into weekly chunks makes it more manageable than monthly or annual views. You can see the immediate impact of a particular purchase or a week of higher-than-usual spending. This is where a well-designed template can make all the difference, turning a chore into an actionable insight.
Setting Up Your Weekly Tracker
Let's build a basic weekly budget tracker in Excel. You can adapt this to your specific needs. We'll create columns for the date, a description of the transaction, the category it falls into, and the amount. We’ll also add columns for income and expenses.
Imagine a simple sheet where each row represents a single financial event. You'll want columns like:
- Date: The day the transaction occurred.
- Description: A brief note, e.g., "Groceries at Market," "Gas fill-up," "Dinner with friends."
- Category: This is crucial for analysis. Examples include "Groceries," "Utilities," "Transportation," "Dining Out," "Entertainment," "Rent/Mortgage," "Salary," "Freelance Income."
- Income: The amount received. Leave blank if it's an expense.
- Expense: The amount spent. Leave blank if it's income.
- Running Balance: This column will show your account balance as each transaction is added.
To set up the "Running Balance," you'll need an initial balance in a cell (let's say cell H1 for now, and you can label it "Starting Balance" in G1). Then, in your first row for a transaction (say row 3), the formula in the "Running Balance" column (let's say column G) would be:
=IF(OR(ISBLANK(D3),ISBLANK(E3)),$H$1,IF(D3<>"",$H$1+D3-E3,IF(E3<>"",$H$1-E3,IF(D3<>"",$H$1+D3,""))))
This formula checks if there's income or expense. If there's income (column D), it adds it to the starting balance. If there's an expense (column E), it subtracts it. If both are blank, it shows nothing. You'll then drag this formula down for each subsequent row, but you’ll need to adjust it slightly. For row 4, the formula would become:
=IF(OR(ISBLANK(D4),ISBLANK(E4)),G3,IF(D4<>"",G3+D4-E4,IF(E4<>"",G3-E4,IF(D4<>"",G3+D4,""))))
Notice how G3 references the balance from the row above. This creates the running total.
Categorizing Your Spending Effectively
The real power of any budget template, including a weekly budget template Excel free, comes from how you categorize your spending. Without clear categories, you're just collecting numbers. Effective categories should be specific enough to be useful but broad enough to avoid creating dozens of them.
Consider these common categories:
- Housing: Rent/Mortgage, property taxes, home insurance.
- Utilities: Electricity, gas, water, internet, phone.
- Food: Groceries, dining out, coffee shops.
- Transportation: Car payments, insurance, gas, public transport, ride-sharing.
- Debt Payments: Credit cards, student loans, personal loans.
- Personal Care: Haircuts, toiletries, gym membership.
- Entertainment: Movies, hobbies, subscriptions, nights out.
- Savings & Investments: Contributions to savings accounts, retirement funds, investments.
- Miscellaneous: Anything that doesn't fit neatly elsewhere.
For freelance work, you might add categories like "Client Meetings," "Software Subscriptions," or "Office Supplies." A template like the Free Weekly Freelance Budget Template can be a good starting point for managing fluctuating income and business expenses.
Tracking Income Sources
Your income section should be just as detailed as your expenses. If you have multiple income streams, list them separately. This could include your primary salary, a side hustle, freelance payments, or even passive income.
For example, you might have rows in your transaction log for:
- Date: 2024-07-15
- Description: Bi-weekly Salary Deposit
- Category: Salary
- Income: 2,500
- Expense:
- Running Balance: (Calculated)
Or:
- Date: 2024-07-17
- Description: Payment for Project X
- Category: Freelance Income
- Income: 750
- Expense:
- Running Balance: (Calculated)
Knowing your net income for the week or month is essential for setting realistic spending limits.
Summarizing Your Weekly Performance
Once you've been logging transactions for a week or two, you'll want to see a summary. This is where pivot tables or SUMIFS formulas come in handy. You can create a separate "Summary" tab or a section on your main sheet.
Let's say your main transaction log is on "Sheet1" with columns A (Date), B (Description), C (Category), D (Income), and E (Expense). On a "Summary" sheet, you can create a list of your categories in column A. In column B, you can use SUMIFS to total the expenses for each category.
For example, if "Groceries" is listed in cell A2 of your "Summary" sheet, the formula in cell B2 to sum all grocery expenses from Sheet1 would be:
=SUMIFS(Sheet1!$E:$E,Sheet1!$C:$C,"Groceries")
You would then drag this formula down for each category. To sum income, you'd use the same logic but reference the Income column (column D) and adjust the category range if needed:
=SUMIFS(Sheet1!$D:$D,Sheet1!$C:$C,"Salary")
This gives you a clear overview of where most of your money is going each week.
Visualizing Your Data with Charts
Numbers alone can be overwhelming. Visualizing your spending with charts can make trends immediately apparent. After you’ve set up your SUMIFS formulas for category totals, you can create a pie chart or a bar chart.
- 01Select your data: Highlight the category names and their corresponding total amounts (income or expense).
- 02Insert Chart: Go to the "Insert" tab in Excel and choose "Recommended Charts" or select a specific chart type like "Pie" or "Bar."
- 03Customize: Adjust the chart title, labels, and colors to make it easy to read. A pie chart is excellent for showing the proportion of spending across different categories. A bar chart can be useful for comparing spending across multiple weeks.
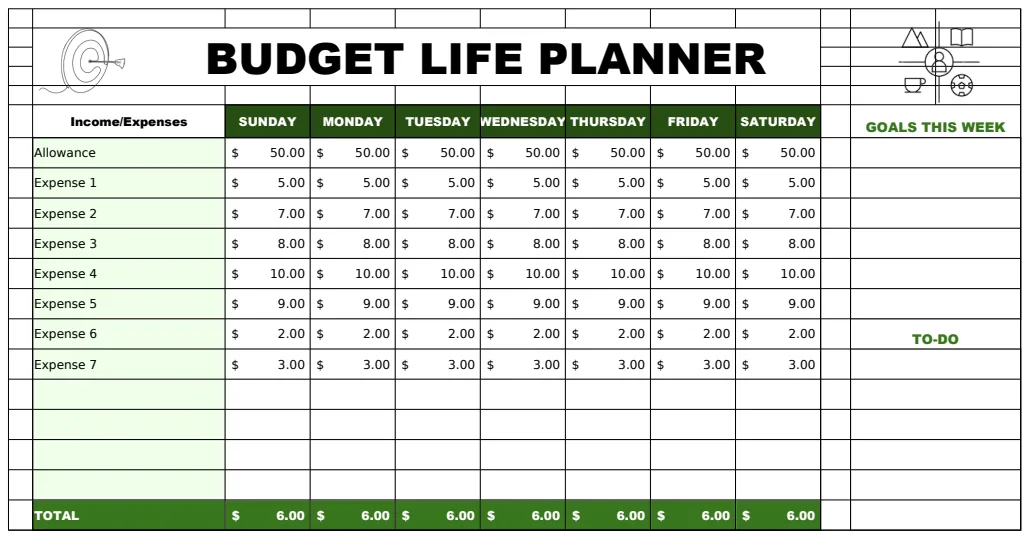
The Budget Life Planner Template often includes built-in charts that update automatically as you log your daily transactions, providing instant visual feedback.
Common Pitfalls to Avoid
When you're setting up and using a weekly budget template Excel free, there are a few common mistakes that can derail your efforts:
- Inconsistent Data Entry: Forgetting to log transactions, or logging them days later, makes your data inaccurate. Try to log expenses as they happen or at least once at the end of each day.
- Overly Complex Categories: Having too many categories makes the system cumbersome. If you have 50 categories, you're unlikely to maintain it. Consolidate where possible.
- Not Reviewing Regularly: A budget template is only useful if you look at it. Schedule time each week to review your spending and make adjustments.
- Unrealistic Budgets: Setting spending limits that are impossible to meet will lead to frustration. Start with your actual spending patterns and gradually adjust downwards.
- Ignoring Income Fluctuations: If your income varies, your budget needs to be flexible. Don't plan to spend your highest possible income every week.
Advanced Features and Tips
To get even more out of your template, consider these advanced features:
Conditional Formatting for Alerts
You can use conditional formatting to highlight categories that are exceeding their budget or nearing a limit. For example, if you've budgeted $100 for "Dining Out" and your SUMIFS total reaches $80, you can set the cell to turn yellow. If it hits $100, it turns red.
To do this:
- 01Select the cells containing your category totals (e.g., B2:B10 on your Summary sheet).
- 02Go to the "Home" tab, click "Conditional Formatting," then "New Rule."
- 03Choose "Format only cells that contain."
- 04Set the rules, for instance: "Cell Value" "less than or equal to" 80, and assign a yellow fill.
- 05Add another rule: "Cell Value" "less than or equal to" 100, and assign a red fill. Adjust these numbers based on your actual budget goals.
Using Data Validation for Categories
To ensure consistency in your category names and prevent typos, use Data Validation.
- 01On your "Summary" sheet, create a list of all your categories in a column (e.g., Column A).
- 02Go to your main transaction log sheet ("Sheet1").
- 03Select the entire "Category" column (Column C).
- 04Go to the "Data" tab, click "Data Validation."
- 05Under "Allow," choose "List."
- 06In the "Source" box, select the range containing your category list on the "Summary" sheet (e.g.,
=Summary!$A$2:$A$15). - 07Click "OK." Now, when you click on a cell in the category column, a dropdown arrow will appear, allowing you to select from your predefined list, significantly reducing errors.
Reconciling with Your Bank Statements
Periodically, compare your spreadsheet's running balance or category totals against your actual bank and credit card statements. This process, known as reconciliation, helps catch any missed transactions or errors in your logging. Look for discrepancies and investigate them immediately.
Adapting for Different Periods
While this focuses on a weekly budget, the principles apply broadly. If you need a monthly view, simply adjust the date column and the summary formulas to encompass an entire month. For a more comprehensive financial overview, consider a template that covers longer periods or integrates savings goals, like the Budget Life Planner Template. The core idea is consistent tracking and analysis.
Can I use this for business expenses?
Yes, with modifications. You'd need to adjust categories to reflect business costs (e.g., "Software," "Marketing," "Supplies"). Also, ensure you're separating personal and business finances completely. For businesses, especially those with project-based work, a template like the Weekly Construction Budget or the Free Weekly Freelance Budget Template might offer more tailored features for tracking project-specific costs and income.
How often should I update my budget?
Ideally, you should update it daily or at least every other day. The more current your data, the more accurate your insights will be. Reviewing your spending trends weekly is crucial for making informed decisions.
What if I have irregular income?
Irregular income is a common challenge. The best approach is to budget based on your average or lowest expected income. When you have a higher-income week, allocate the surplus to savings, debt repayment, or an emergency fund rather than increasing your regular spending. This provides a buffer for leaner weeks.
Is there a cost for these templates?
OpenWorksheet offers a library of templates, including various budgeting tools. The library costs a one-time fee of $9 for unlimited downloads, giving you access to all available templates. This allows you to find the perfect fit for your needs without recurring subscriptions.