Track your email campaign performance with this spreadsheet
Build an effective email marketing tracker spreadsheet to centralize campaign data and see what works for better results.
Tracking email marketing performance in a spreadsheet is either a meticulous, hours-long manual effort or a streamlined process with the right setup. The latter holds up for any serious marketer. Building an effective email marketing tracker spreadsheet from scratch can feel daunting, especially when you're juggling campaign creation, audience segmentation, and content planning. Many marketers resort to basic lists or disconnected data points, missing the crucial insights that drive better results.
An organized email marketing tracker spreadsheet centralizes your campaign data, allowing you to see what works and what doesn't. This isn't just about vanity metrics like open rates; it's about understanding conversion rates, revenue generated, and subscriber engagement over time. When you have this data readily available, you can make informed decisions about your future email strategies.
Essential Columns for Your Tracker
To build a robust email marketing tracker spreadsheet, you need to define the core metrics you'll be monitoring. Start with the basics that every campaign generates.
Here’s a foundational set of columns to include:
- Campaign Name: A clear, descriptive name for each email send (e.g., "Q3 Product Launch Announcement," "Weekly Newsletter - July 15").
- Send Date: The exact date and time the campaign was sent. This is critical for tracking performance over specific periods.
- Target Audience/Segment: Who received this email? (e.g., "New Subscribers," "High-Value Customers," "Blog Readers").
- Subject Line: The subject line used. This helps you identify which subject lines perform best.
- Preheader Text: The snippet of text that appears after the subject line in most inboxes.
- List Size: The total number of subscribers on the list for that specific send.
- Sent Count: The number of emails actually delivered (accounting for bounces).
- Bounced Count: The number of emails that failed to deliver.
- Open Count: The total number of times the email was opened.
- Unique Open Rate: (Unique Opens / Sent Count) * 100. This shows the percentage of recipients who opened your email.
- Click Count: The total number of clicks on links within the email.
- Unique Click Count: The number of unique recipients who clicked a link.
- Click-Through Rate (CTR): (Unique Clicks / Sent Count) * 100. The percentage of recipients who clicked a link.
- Click-to-Open Rate (CTOR): (Unique Clicks / Unique Opens) * 100. This measures how engaging your email content is for those who opened it.
- Conversion Count: The number of desired actions taken after clicking (e.g., purchases, sign-ups, downloads). This requires integration with your website analytics or CRM.
- Conversion Rate: (Conversion Count / Sent Count) * 100. The percentage of recipients who completed the desired action.
- Revenue Generated: The total revenue directly attributable to this email campaign. This is a crucial metric for ROI.
- Cost Per Send: The cost associated with sending this particular campaign (if applicable, e.g., platform fees).
- ROI: (Revenue Generated - Cost Per Send) / Cost Per Send * 100. The return on investment for the campaign.
Setting Up Your Spreadsheet
Let's walk through creating a basic structure in Excel or Google Sheets. Assume your data will start on row 2, with your column headers in row 1.
- 01Create Headers: In row 1, type the column names listed above. Make them bold for clarity.
- 02Format Dates: Select the "Send Date" column, right-click, and choose "Format Cells" (or "Number format" in Google Sheets). Select "Date" and choose your preferred format (e.g., MM/DD/YYYY).
- 03Format Percentages: Select the columns for "Unique Open Rate," "CTR," "CTOR," and "Conversion Rate." Format them as "Percentage." You may need to adjust the number of decimal places.
- 04Format Currency: Select the "Revenue Generated" and "Cost Per Send" columns. Format them as "Currency."
- 05Enter Sample Data: Fill in a few rows with imaginary campaign data. For example, for a "Welcome Series - Email 1" campaign sent on July 18th to 500 new subscribers, with 150 opens, 20 clicks, and 5 conversions generating $100 in revenue.
Now, let's add formulas to automate calculations.
Automating Key Metrics with Formulas
Manual calculation of rates and ROI is tedious and prone to error. Formulas bring your email marketing tracker spreadsheet to life.
- Unique Open Rate: In cell G2 (assuming "Unique Open Rate" is the 7th column and data starts from row 2), enter
=IFERROR(D2/F2, 0). Format this column as Percentage. This formula divides "Open Count" (D2) by "Sent Count" (F2).IFERRORhandles cases where "Sent Count" might be zero, preventing a #DIV/0 error. - Click-Through Rate (CTR): In cell J2, enter
=IFERROR(I2/F2, 0). Format as Percentage. This divides "Unique Click Count" (I2) by "Sent Count" (F2). - Click-to-Open Rate (CTOR): In cell K2, enter
=IFERROR(I2/H2, 0). Format as Percentage. This divides "Unique Click Count" (I2) by "Open Count" (H2). - Conversion Rate: In cell M2, enter
=IFERROR(L2/F2, 0). Format as Percentage. This divides "Conversion Count" (L2) by "Sent Count" (F2). - ROI: In cell P2, enter
=IFERROR((N2-O2)/O2, 0). Format as Percentage. This calculates the profit (Revenue - Cost) divided by the cost.
Remember to drag the fill handle (the small square at the bottom-right of the selected cell) down to apply these formulas to all your rows.
Tracking Beyond the Basics
Once your core metrics are in place, consider adding columns for qualitative data or advanced segmentation.
- Campaign Goal: What was the primary objective for this email? (e.g., "Drive Sales," "Increase Website Traffic," "Gather Feedback").
- Call to Action (CTA): What was the specific CTA? (e.g., "Shop Now," "Read More," "Download Guide").
- A/B Test Variation: If you ran an A/B test, note which variation this row represents (e.g., "Subject Line A," "Image Variant B").
- Notes/Learnings: A free-text field for any observations, issues encountered, or insights gained. This is invaluable for future campaign planning.
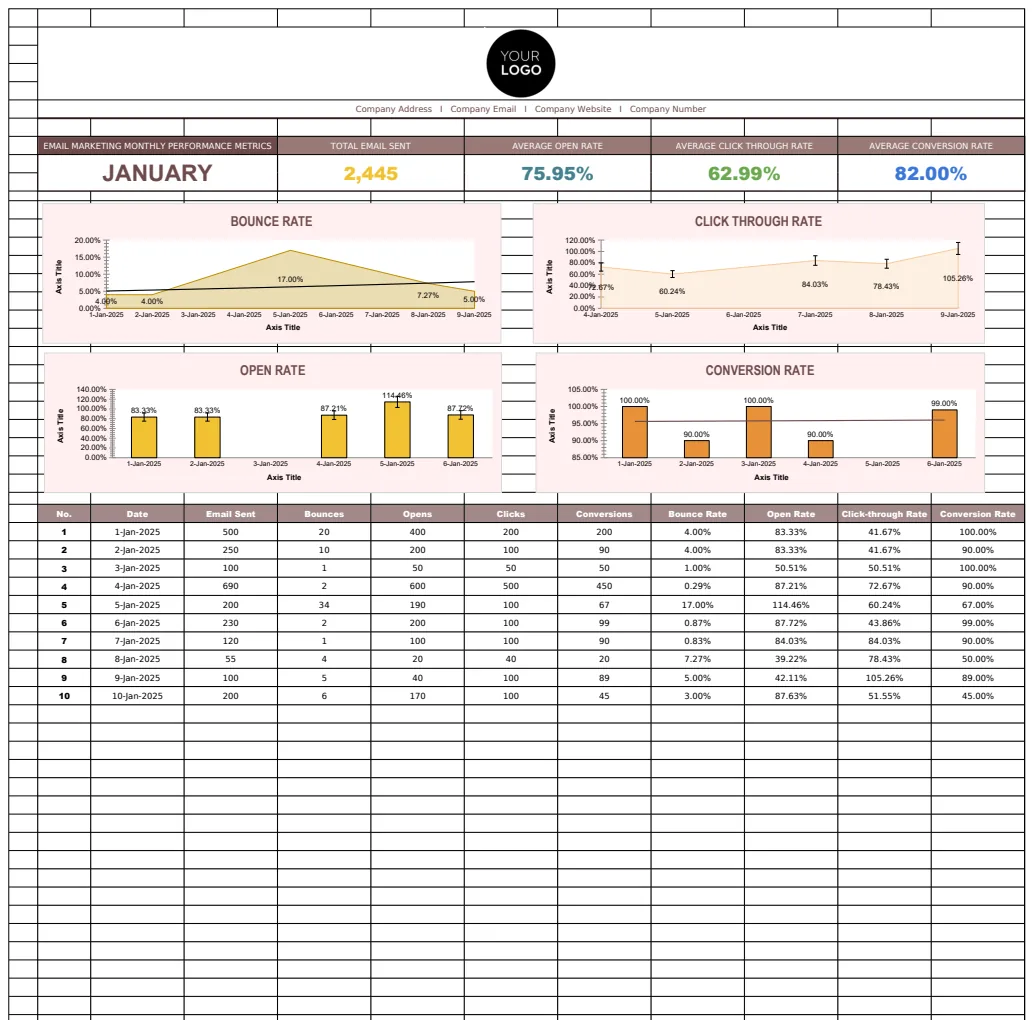
If you find yourself needing to track multiple campaigns across different months and want automated charts and summaries, a template can save significant setup time. The Email Marketing Monthly Performance Metrics Template is designed for this, automatically calculating key performance indicators and visualizing trends.
Common Mistakes to Avoid
Many marketers fall into predictable traps when setting up or using their email marketing tracker spreadsheet.
- Inconsistent Naming Conventions: If "Product Launch" is sometimes spelled "Prod Launch" or "Product_Launch," your reporting will be fragmented. Standardize campaign names.
- Ignoring Bounces: Not tracking and cleaning your bounced email addresses leads to inflated "Sent Count" and skewed deliverability metrics.
- Confusing Open vs. Unique Opens: While total opens are interesting, unique opens represent distinct individuals engaging with your email. Focus on unique metrics for true audience engagement.
- Forgetting Conversion Tracking: The ultimate goal of most email marketing is action. If you don't track conversions, you're missing the most important ROI indicator.
- Not Segmenting Data: Sending the same email to everyone and tracking it as one campaign misses opportunities to understand what resonates with different audience segments.
Advanced Analysis and Visualization
A well-structured spreadsheet is the foundation, but visualization transforms raw data into actionable insights.
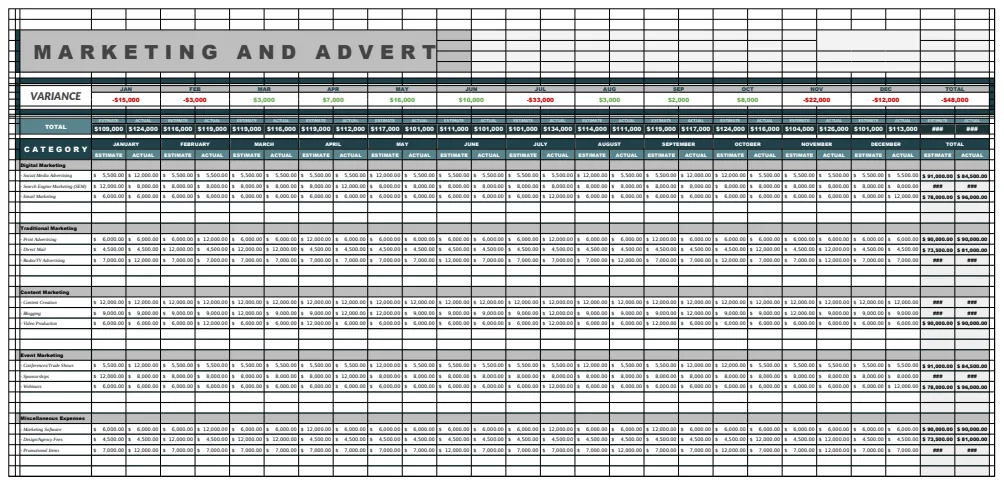
If you're looking to get a broader view of your marketing efforts, combining email performance with other channels, the Marketing KPI Dashboard Template can provide a holistic overview. It helps contextualize email marketing success against overall business goals.
For instance, you might create pivot tables within your spreadsheet to analyze:
- Average CTR by Audience Segment.
- Total Revenue Generated per Month.
- Best Performing Subject Lines (based on CTOR or Conversion Rate).
- ROI by Campaign Type.
These analyses can reveal patterns that might be hidden in the raw data. You can then use conditional formatting to highlight high or low performers directly in your main table. For example, you could set up a rule to color-code ROI cells: green for >20%, yellow for 5%-20%, and red for <5%.
Integrating with Other Tools
Your email marketing tracker spreadsheet doesn't have to live in isolation. While manual entry is possible, integrating with your email service provider (ESP) can automate data collection. Many ESPs allow you to export campaign reports directly as CSV files, which you can then import into your spreadsheet.
For more complex needs, consider if a dedicated marketing analytics platform is warranted. However, for many small to medium-sized businesses, a well-maintained spreadsheet, perhaps enhanced with templates like the Email Marketing Monthly Performance Metrics Template, provides sufficient power and flexibility. The ability to download all our templates for a single one-time fee of $9 means you can access a variety of tools without ongoing subscriptions.
What if I have multiple email marketing platforms?
If you're using different platforms for different purposes (e.g., one for newsletters, another for transactional emails), you can either:
- 01Create separate tabs within your main spreadsheet for each platform, maintaining the same column structure across all.
- 02Consolidate data from all platforms into a single master sheet. This usually involves exporting from each platform and then copying and pasting or using import functions, ensuring your column headers match.
How often should I update my tracker?
Ideally, you should update your email marketing tracker spreadsheet after each significant campaign send, or at least weekly. This ensures your data is current and you can spot trends or issues early. For automated imports, schedule them regularly.
What if I can't track revenue directly?
If direct revenue attribution is challenging, focus on proxy metrics that indicate purchase intent or engagement. This could include lead generation numbers, demo requests, or even traffic to specific product pages. While not as direct as revenue, these can still serve as valuable indicators of campaign success.