Where to find free Excel Gantt chart templates?
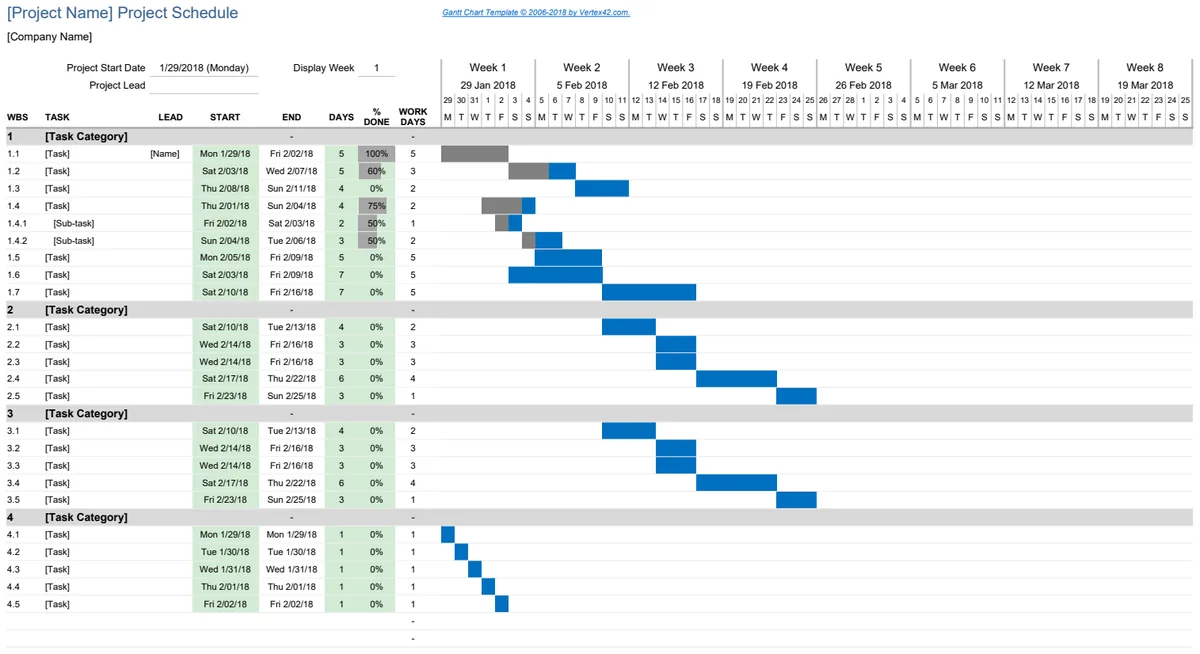
Find free Excel Gantt chart templates and learn how to avoid common project planning pitfalls with these helpful resources.
The most common pitfall when using a Gantt chart template in Excel is mismanaging task dependencies, which quickly renders the entire schedule inaccurate. This usually stems from not clearly defining which tasks must finish before others can begin, or by not updating those relationships when the schedule inevitably shifts. If you're searching for a gantt chart template Excel free download, understanding this common problem upfront will help you avoid the most frustrating aspects of project planning.
Excel's flexibility is its strength, but it also means you can easily create a Gantt chart that looks right but is functionally broken. This often happens with manual updates to task bars and dates, which don't automatically account for changes in preceding or succeeding tasks. A well-structured template, even a free one, should guide you toward proper dependency setup from the start.
Understanding Gantt Chart Dependencies
At its core, a Gantt chart visualizes tasks over time. But what makes it powerful for project management is its ability to show how tasks relate to each other. These are called dependencies. The most common types are:
- Finish-to-Start (FS): Task B cannot start until Task A finishes. This is the most prevalent type. For example, you can't start "Writing Report" until "Data Collection" is finished.
- Start-to-Start (SS): Task B cannot start until Task A starts. This is less common but useful, like "Begin Marketing Campaign" can't start until "Website Launch" starts.
- Finish-to-Finish (FF): Task B cannot finish until Task A finishes. For example, "Finalize Documentation" can't finish until "Product Testing" finishes.
- Start-to-Finish (SF): Task B cannot finish until Task A starts. This is rare and often indicates a complex or poorly defined process.
When you download a Gantt chart template, look for how it handles these. Does it have columns for preceding tasks? Does it offer any visual indicators or built-in formulas that react to these relationships? If it's just a series of colored bars and dates, you'll be doing a lot of manual recalculating.
Essential Columns for Your Gantt Chart
Whether you're building from scratch or adapting a template, certain columns are non-negotiable for a functional Gantt chart. Aim for clarity and completeness.
- Task Name: A clear, concise description of the work to be done.
- Duration: The estimated time needed to complete the task, typically in days.
- Start Date: When the task is scheduled to begin.
- Finish Date: When the task is scheduled to be completed.
- Predecessors: The task(s) that must be completed (or started) before this task can begin (or start). This is crucial for dependency management.
- % Complete: A numerical representation (0-100%) of how much of the task is finished.
- Assigned To: Who is responsible for the task.
- Status: A quick indicator (e.g., Not Started, In Progress, Completed, On Hold, Delayed).
Many free templates might simplify this, perhaps omitting "Assigned To" or "Status" to keep the visual clean. However, "Predecessors" is the linchpin for automated scheduling. If a template doesn't explicitly support this, you're likely heading for manual recalculations.
Setting Up a Simple Gantt Chart in Excel
Let's walk through creating a basic Gantt chart in Excel, assuming you want to avoid a dedicated download for now. This illustrates the principles behind good templates.
- 01Create Your Data Table: Set up columns for "Task Name," "Duration (Days)," "Start Date," and "Finish Date." You might also add "Predecessors" if you're ambitious.
- 02Input Your Tasks: List all the project tasks. Keep them granular enough to be manageable.
- 03Estimate Durations: Assign a realistic number of days for each task.
- 04Determine Start Dates: This is where dependencies come into play.
- For the first task, set a specific start date.
- For subsequent tasks, the "Start Date" is often the "Finish Date" of its predecessor plus one day (for a Finish-to-Start dependency). If Task 1 finishes on Jan 5th, Task 2 starts on Jan 6th.
- You can use a simple formula:
=IF(ISBLANK(E2),"",D2+1)assuming "Finish Date" is in column D and "Predecessors" (which would need a lookup to find the predecessor's finish date) is in column E. For a purely manual setup without predecessors, you'd just type the date.
- 05Calculate Finish Dates: The "Finish Date" is typically "Start Date" + "Duration" - 1. The "-1" accounts for including both the start and end days in the duration. The formula would be:
=IF(ISBLANK(C2),"",C2+B2-1)where "Start Date" is in C2 and "Duration" is in B2. - 06Add Conditional Formatting for the Bars: This is the visual part.
- Create a series of columns representing days on your timeline (e.g., Jan 1, Jan 2, Jan 3, etc.).
- Select the cells for your first task's timeline (e.g., from the "Start Date" column to the end of your project timeline).
- Go to Conditional Formatting > New Rule.
- Choose "Use a formula to determine which cells to format."
- The formula needs to check if the date in the column header falls within the task's start and end dates. For a date in cell F1 and a task with Start Date in C2 and Finish Date in D2, the formula would be:
=AND(F$1>=$C2,F$1<=$D2). - Apply a fill color (e.g., blue) to these cells.
- Repeat for each task, adjusting the row reference (C2, D2, C3, D3, etc.).
This manual process highlights why a well-designed template is invaluable. It automates the dependency calculations and conditional formatting, saving you hours. If you want a head start, a template like Project Schedule Gantt Chart can provide this structure.
Common Mistakes to Avoid
Even with a downloaded template, users often fall into predictable traps that undermine the Gantt chart's utility.
- Over-complicating Tasks: Breaking down tasks too granularly can make the chart unreadable and difficult to manage. Conversely, tasks that are too broad lack actionable detail. Aim for tasks that can be completed within a few days to a week.
- Ignoring Milestones: Milestones are significant points in a project, not tasks with duration. They should be represented as zero-duration events (e.g., Task Name: "Project Kick-off," Duration: 0 Days). Many templates don't clearly distinguish these.
- Not Updating Regularly: A Gantt chart is a living document. If you don't update task completion and actual start/finish dates frequently, it quickly becomes irrelevant. Schedule brief, regular check-ins to keep it current.
- Manual Date Adjustments: As mentioned, manually changing dates without updating dependencies is the surest way to create an inaccurate schedule. Rely on the template's logic or formulas to propagate changes.
- Unrealistic Durations: Underestimating how long tasks will take is a common project management error. Be honest and build in some buffer time.
When a Free Download Isn't Enough
While many Excel gantt chart template Excel free download options exist, they often come with limitations. They might lack advanced features like resource leveling, critical path analysis, or automated baseline tracking. They also might have complex or poorly documented formulas that are difficult to modify.
If your project is complex, has many interdependencies, or requires tracking multiple resources, a free template might become more of a burden than a help. You'll spend more time fixing it than using it. In such cases, investing in a professional template can save significant time and prevent costly errors. A template like the Gantt Chart Project Schedule is designed to handle more intricate project structures.
Enhancing Your Gantt Chart with Excel Features
Even if you start with a basic template, Excel offers tools to make your Gantt chart more powerful.
- Conditional Formatting: Beyond coloring the bars, you can use it to highlight overdue tasks (where the finish date has passed and % Complete is less than 100%) or tasks that are behind schedule. A rule like
=AND(D2<TODAY(),$G2<1)(assuming Finish Date is D2 and % Complete is G2) can flag overdue items. - Data Validation: For the "Status" column, use Data Validation to create a dropdown list (e.g., "Not Started," "In Progress," "Completed"). This ensures consistency and reduces typos.
- Formulas for Critical Path: While more advanced, you can use formulas to identify the critical path, the sequence of tasks that determines the project's shortest possible duration. Any delay on a critical path task directly delays the project end date.
- Slicers and Timelines: If your template is structured with a data table, you can add Slicers and Timeline visuals to filter tasks by assignee, status, or date range, making it easier to view specific aspects of the project.
What About Operations and Training?
Gantt charts aren't just for IT projects. The same principles apply to many fields. For operations management, visualizing production schedules, equipment maintenance, or workflow bottlenecks can be significantly improved with a Gantt chart. The Operations Management Gantt Chart template is tailored for these kinds of workflows. Similarly, for team development, tracking training modules, skill acquisition timelines, and certification progress can be clearly mapped out using a dedicated Training Schedule Gantt Chart. The core functionality of task visualization and dependency management remains the same, regardless of the domain.
Can I Use a Gantt Chart for Personal Projects?
Absolutely. While often associated with large-scale business projects, Gantt charts are excellent for managing personal goals like home renovations, wedding planning, or even writing a book. The key is to break down your personal project into discrete, manageable tasks with estimated durations and deadlines.
How Do I Handle Task Dependencies in a Free Template?
If your free template doesn't have explicit predecessor columns or automated dependency calculations, you'll need to manage dependencies manually. This means when a predecessor task's finish date changes, you must manually update the start and finish dates of all dependent tasks. This is tedious and error-prone, which is why templates with built-in dependency logic are generally superior.
What's the Difference Between a Gantt Chart and a Calendar View?
A calendar view typically shows tasks on specific days, often in a grid format similar to a wall calendar. It's good for seeing what's happening on any given day. A Gantt chart, however, visualizes the duration of tasks and their sequence over a longer period. It excels at showing project timelines, task relationships, and overall project progress, which a standard calendar view doesn't effectively do.
Where Can I Find More Advanced Gantt Chart Features?
For features like resource leveling, critical path analysis, budget tracking, and collaborative capabilities, you'll likely need to look beyond basic Excel templates. Many dedicated project management software solutions offer these advanced features, often with more intuitive interfaces for complex projects. However, for many users, a well-structured Excel template provides a significant improvement over manual tracking and is sufficient for most project needs. For a one-time fee of $9, our library offers unlimited downloads of professionally designed templates that include robust features.