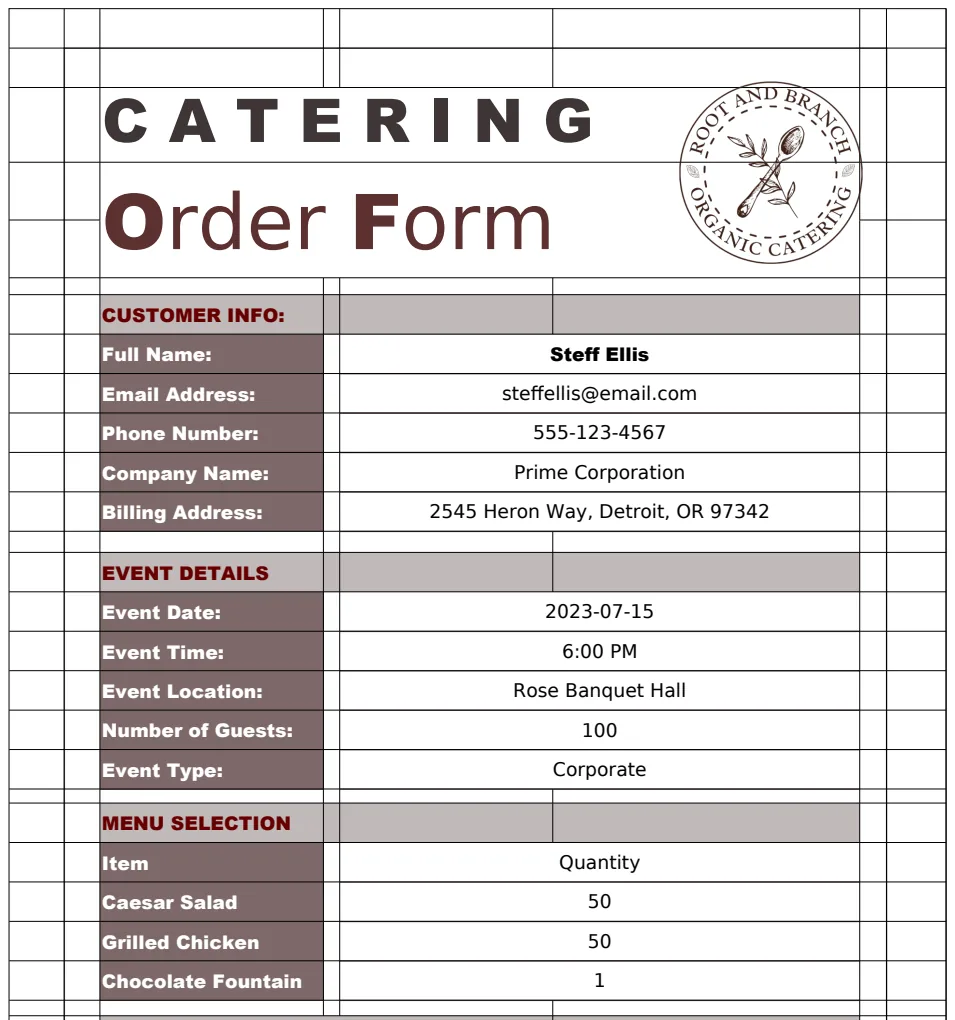
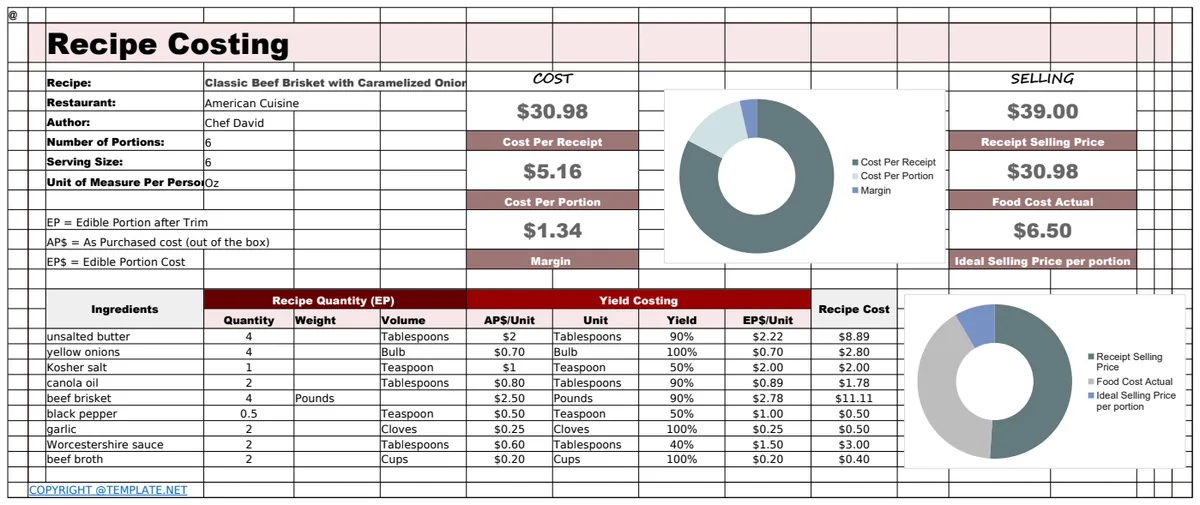
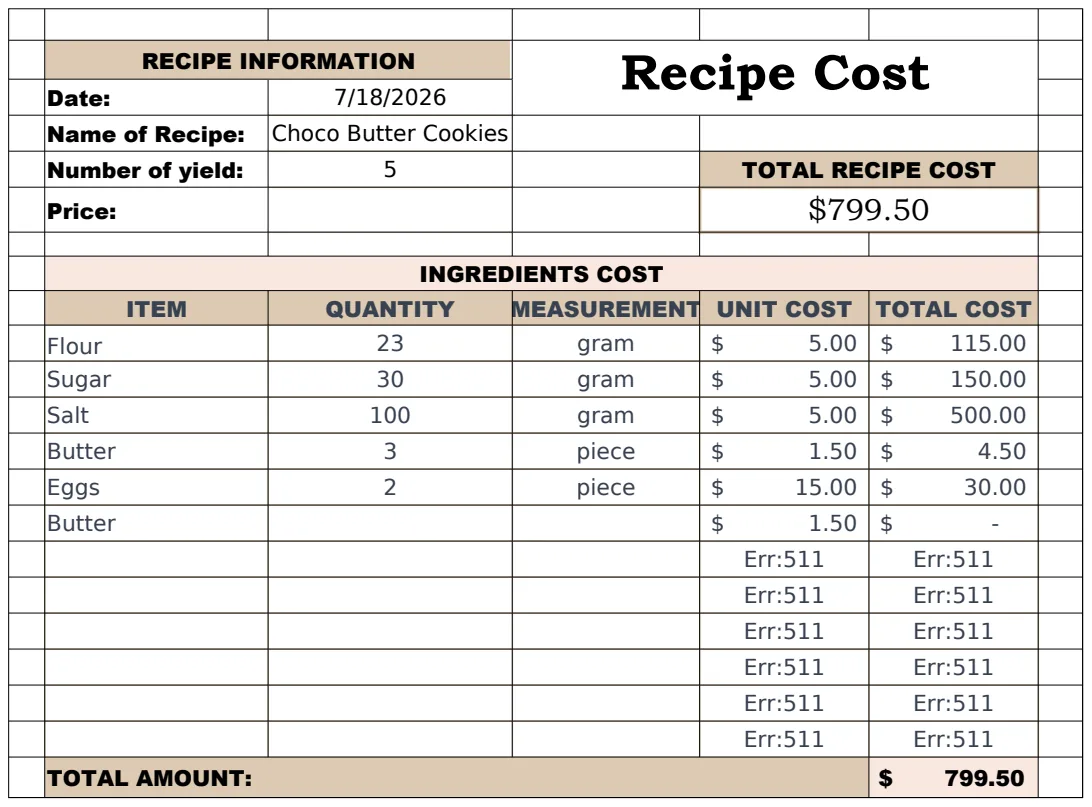
Your free restaurant budget spreadsheet template
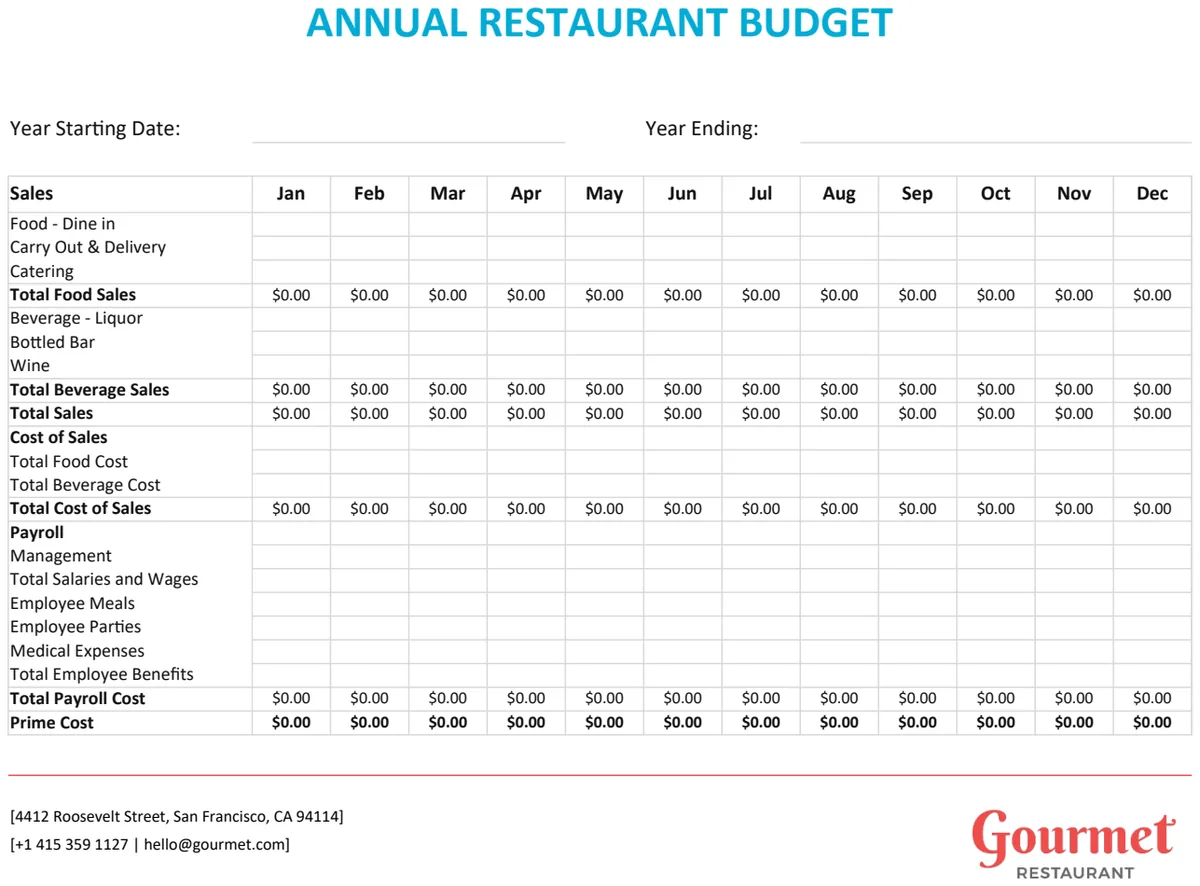
Discover how a free restaurant budget spreadsheet template can be a powerful financial control tool for your business.
It's a common misconception that a restaurant budget spreadsheet template free download can't be robust enough for real-world use. Many believe such templates are too basic, lacking the
detail needed to manage a busy kitchen or dining room. The reality is that with a few smart additions, a free template can become a powerful financial control tool. The key isn't the price tag, but how you structure and utilize the data within it.
For instance, a well-built budget spreadsheet can highlight discrepancies between projected and actual food costs, often revealing waste or theft. It can also track labor expenses against revenue, ensuring you're not overstaffed during slow periods. A free template, when customized, can offer insights that rival expensive software.
Essential Components of a Restaurant Budget Template
At its core, any effective restaurant budget template needs to track income and expenses. This means having clear categories for both. For income, you'll want to differentiate between various revenue streams if applicable, such as dine-in, takeout, delivery, and perhaps even catering or merchandise sales. For expenses, a granular breakdown is crucial.
Think beyond broad categories like "food" and "labor." Within food costs, you should break down expenses by major inventory items: produce, meat, seafood, dairy, dry goods, beverages (alcoholic and non-alcoholic). For labor, separate fixed costs (salaries for managers, chefs) from variable costs (hourly wages for servers, kitchen staff). Other essential expense categories include rent or mortgage, utilities (electricity, gas, water, internet), marketing and advertising, insurance, licenses and permits, repairs and maintenance, supplies (cleaning, disposables), POS system fees, and credit card processing fees.
Income Tracking Specifics
Your income section should allow for daily, weekly, and monthly totals. Consider columns for:
- Date: When the revenue was generated.
- Day of Week: Useful for analyzing performance trends.
- Revenue Stream: Dine-in, Takeout, Delivery, Catering, etc.
- Gross Sales: Total sales before any discounts or refunds.
- Discounts/Compensations: Any promotional discounts applied.
- Net Sales: Gross Sales minus Discounts. This is your primary revenue figure.
- Payment Method: Cash, Credit Card, Mobile Pay. This can help track processing fees.
A simple formula to calculate Net Sales would be = [Gross Sales] - [Discounts/Compensations]. Summing these Net Sales figures across all revenue streams and payment methods for a given period will give you your total income.
Expense Tracking Specifics
This is where the detail really matters. For expenses, you'll want to track actual spending against your budgeted amounts. Columns should include:
- Date: When the expense was incurred or paid.
- Category: The broad type of expense (e.g., Food, Labor, Rent).
- Sub-Category: A more specific item (e.g., Produce, Server Wages, Electricity).
- Vendor/Supplier: Who you paid.
- Description: A brief note about the expense.
- Budgeted Amount: The amount you planned to spend for that period.
- Actual Amount: The amount you actually spent.
- Variance: The difference between Budgeted and Actual.
The variance formula is straightforward: = [Budgeted Amount] - [Actual Amount]. A positive variance means you spent less than budgeted, which is good. A negative variance indicates you overspent.
Setting Up Your Budgeted Amounts
Forecasting is the bedrock of budgeting. You need to establish realistic targets for both income and expenses.
For income, look at historical data. If you have sales figures from the previous year, use them as a baseline, adjusting for seasonality, planned marketing campaigns, or changes in pricing. For a new restaurant, research local competition and demographic data to make informed projections.
For expenses, start with fixed costs like rent and salaries, which are generally predictable. Variable costs require more estimation. For food costs, a common industry benchmark is 28-35% of net sales. If your projected net sales for the month are $50,000, you might budget $15,000 for food (30%). Labor costs often fall in the 25-35% range. Utilities can be estimated based on past bills or by getting quotes from providers.
It's wise to build in a contingency fund, typically 5-10% of total expenses, for unexpected costs.
Calculating Key Performance Indicators (KPIs)
A budget spreadsheet isn't just about listing numbers; it's about deriving actionable insights. KPIs help you understand your restaurant's financial health at a glance.
Common restaurant KPIs include:
- Food Cost Percentage: (Total Food Costs / Total Net Sales) * 100. This is paramount. Aim to keep this as low as possible without sacrificing quality.
- Labor Cost Percentage: (Total Labor Costs / Total Net Sales) * 100. Monitor this closely, especially against revenue fluctuations.
- Prime Cost: Food Costs + Labor Costs. This should ideally be between 55-65% of net sales.
- Profit Margin: (Net Sales - Total Expenses) / Net Sales * 100. This is your ultimate profitability measure.
You can calculate these directly in your spreadsheet using formulas that reference your summary rows. For example, if your total net sales are in cell B10, total food costs in B25, and total labor costs in B35, your Prime Cost percentage formula would be = (B25 + B35) / B10. Formatting this cell as a percentage is essential.
Implementing Variance Analysis
Variance analysis is the process of comparing your budgeted figures to your actual results and understanding why differences occurred. This is where the "free" template becomes invaluable.
Regularly (weekly is ideal, monthly at a minimum), review the variance column for each expense category.
- Significant Overspending: If your "Produce" expense is 15% over budget, investigate why. Did prices increase? Was there excessive spoilage? Is inventory being managed poorly?
- Significant Underspending: If "Marketing" is significantly under budget, you might be missing opportunities. Are you not running planned ads?
- Revenue Shortfalls: If net sales are consistently below budget, it signals a need to re-evaluate sales strategies, pricing, or customer service.
This analysis should prompt action. If food costs are too high, you might renegotiate with suppliers, implement stricter inventory controls, or adjust menu prices. If labor costs are creeping up, you might look at scheduling optimization.
Advanced Features for a Free Template
While basic income and expense tracking is fundamental, you can enhance a free template with more advanced features.
Cash Flow Projections
Beyond a simple profit and loss budget, projecting your cash flow is critical. This involves tracking when money actually comes in and goes out, not just when it's earned or incurred.
Create a section with columns for:
- Beginning Cash Balance: How much cash you start the period with.
- Cash Inflows: Actual cash received from sales (consider payment processing times for credit cards).
- Cash Outflows: Actual cash paid out for expenses (rent, payroll, supplier payments).
- Net Cash Flow: Cash Inflows minus Cash Outflows.
- Ending Cash Balance: Beginning Cash Balance + Net Cash Flow.
This helps you anticipate potential cash shortages and plan accordingly. For example, if you know a large supplier payment is due next week but customer payments are slow, you can arrange for a line of credit or adjust spending.
Break-Even Analysis
Understanding your break-even point, the sales volume needed to cover all your costs, is vital for pricing and sales targets.
To calculate this, you need to know your fixed costs (rent, salaries, insurance) and your variable costs (food, hourly wages, credit card fees). You also need your average selling price per item or average check size.
A simplified break-even formula in units is: Fixed Costs / (Average Selling Price Per Unit - Average Variable Cost Per Unit). In monetary terms: Fixed Costs / Contribution Margin Ratio. The contribution margin ratio is (Average Selling Price - Average Variable Cost) / Average Selling Price.
While complex to set up precisely in a basic template, you can approximate it by summing all fixed costs and dividing by your gross profit margin percentage. This gives you a target revenue figure you must hit just to cover expenses.
Common Mistakes to Avoid
Even with a well-structured template, pitfalls exist.
- Lack of Regular Updates: The biggest mistake is entering data sporadically. A budget is only useful if it reflects current reality. Dedicate time weekly, or even daily, to inputting sales and expense data.
- Unrealistic Projections: Overly optimistic sales forecasts or underestimating expenses will lead to a budget that's impossible to meet, rendering it useless. Be conservative.
- Ignoring Variances: Seeing a variance and not investigating it is a missed opportunity. The "why" behind the numbers is where the real value lies.
- Not Differentiating Fixed vs. Variable Costs: Understanding which costs change with sales volume and which remain constant is key to accurate forecasting and break-even calculations.
- Forgetting Hidden Costs: Don't overlook items like credit card processing fees, bank charges, or small but recurring supply costs. They add up.
Frequently Asked Questions
How often should I update my budget spreadsheet?
Ideally, you should update your income and variable expense data daily or at least weekly. Fixed costs can be updated monthly. The key is consistency; a budget that isn't regularly fed new data quickly becomes irrelevant.
What if my actual expenses are consistently higher than my budget?
This indicates a need for a thorough review. First, verify the accuracy of your data entry. If the data is correct, analyze which categories are consistently over budget. This might mean renegotiating supplier contracts, implementing stricter inventory controls to reduce waste, optimizing staffing schedules, or even considering modest price increases on certain menu items.
Can a free template handle seasonal fluctuations in sales?
Yes, absolutely. You can create separate budget tabs or sections for different seasons or months. For example, your "Budgeted Food Costs" for December might be significantly higher than for January due to holiday demand. You would adjust your budgeted income and expense figures on a month-by-month basis within your template to reflect these seasonal variations.
How do I incorporate new menu items or special events into the budget?
When introducing a new menu item, estimate its projected sales volume and cost of goods sold. Add these projections to your relevant income and expense categories for the budget period. For special events, create a separate budget line item or a mini-budget within your main template to track projected income and specific expenses associated with the event (e.g., extra staffing, special decorations, promotional materials).