
Rental Property Deal Analyzer
A rental property calculator in Excel for real estate investors. NOI, cap rate, cash-on-cash, DSCR and after-tax IRR on one master tab, with local property-tax rules, a 1-12 unit rent roll and a 2026-2036 projection.
Rental Property Deal Analyzer puts the full underwriting of a rental property on one master tab. Enter the price, closing costs, rehab, financing, vacancy and holding period, and it calculates net operating income, cap rate on price and on all-in cost, cash-on-cash return, monthly cash flow per unit, debt service coverage ratio, break-even occupancy, operating expense ratio, gross rent multiplier, debt yield, the 1% rule and after-tax IRR. A scorecard checks each metric against your own targets and gives the deal a verdict.
The Units tab is a rent roll for 1 to 12 units with current rent, market rent, other income, status and lease end, plus property-level income such as laundry. Switch between current and market rents to test a value-add plan. The Expenses tab covers operating costs as monthly or annual amounts, a percentage of income or a percentage of value.
Location profiles localize the numbers. Each profile holds the property tax rate, assessment ratio, exemption or abatement, any annual reassessment cap, insurance as a percentage of value and its yearly trend, buyer closing costs, transfer tax on sale, state income tax and local appreciation and rent adjustments. Property tax is calculated as value times assessment ratio less exemption, times the rate, and grows with appreciation up to the cap. Example profiles cover a range of markets and can be edited to match your county.
The 2026-2036 projection runs year by year under a Base, Bull or Bear scenario, each with its own appreciation, rent growth, expense inflation and vacancy for every year. It shows income, operating costs, NOI, debt service, interest and principal, depreciation over 27.5 years, taxable income and income tax, after-tax cash flow, property value, loan balance and equity. For every year it also shows what you would net if you sold, after selling costs, transfer tax, depreciation recapture and capital gains, with the after-tax IRR and equity multiple.
Sensitivity tables show cash-on-cash and cap rate across price and rent changes, and monthly cash flow across interest rates and down payments. A Quick Screener compares up to six properties side by side and ranks them, and the Amortization tab gives the monthly loan schedule. About 4,000 formulas sit in locked cells and protection has no password, so you can unprotect any tab to customise it. Location profiles and macro scenarios are illustrative examples, not official rates or forecasts, and results are estimates, not investment or tax advice. Built for Microsoft Excel (desktop or Excel for the web) and contains no macros.
What's inside
- 11 connected tabs, from a quick-start guide to Settings
- NOI, cap rate, cash-on-cash and DSCR on one master tab
- After-tax IRR and equity multiple for any holding period
- Scorecard against your own targets with a deal verdict
- Rent roll for 1 to 12 units with current and market rents
- Location profiles for property tax, caps and insurance
- 2026-2036 projection with Base, Bull and Bear scenarios
- Depreciation, interest and tax effect on cash flow
- Net sale proceeds after recapture and capital gains each year
- Break-even occupancy, GRM, debt yield and 1% rule
- Sensitivity tables for price, rent, rate and down payment
- Quick Screener ranking up to 6 properties
- Monthly loan amortization schedule
- Locked formulas, no macros
Download this template
.xlsx · 11 sheets · includes charts
$9/monthDownload up to 10 templates a month from a library of thousands. Cancel anytime.
- 10 downloads every month
- Cancel anytime
- 14-day refund policy
More in Personal Finance & Loans
 Personal Finance & Loans
Debt Snowball vs Avalanche Simulator
A debt payoff simulator in Excel. Compare Snowball, Avalanche, your own custom order and minimum payments side by side, month by month, with promo rates ending, rate spikes, extra payments and lump sums.
- 9 connected tabs, from a quick-start guide to Settings
- Up to 10 debts simulated month by month for 30 years
- Snowball, Avalanche, Custom and minimum-only plans side by side
 Personal Finance & Loans
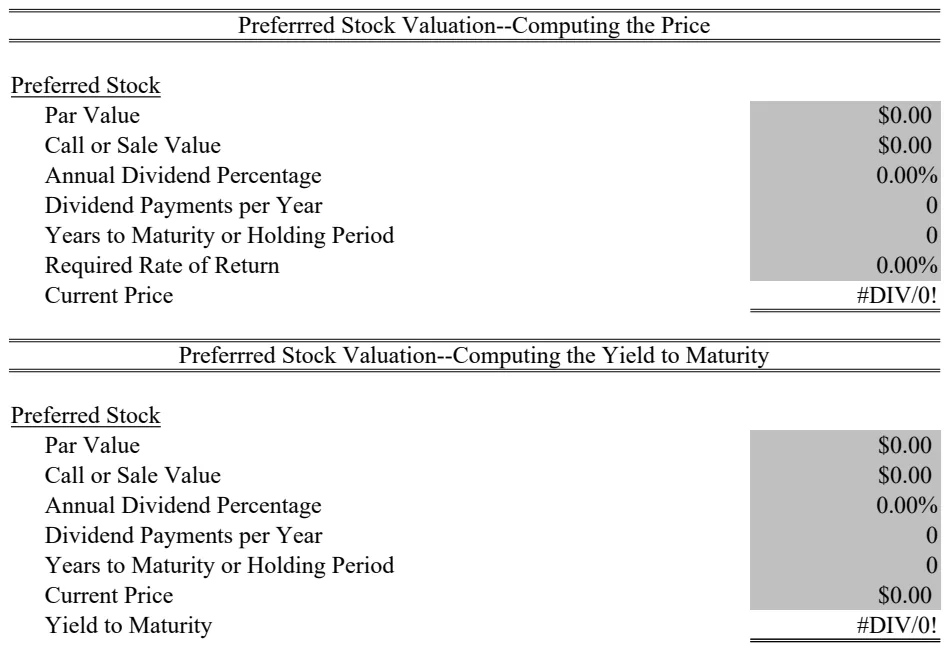
Preferred Stock Valuation Calculator
Calculate preferred stock fair value and pricing using dividend yield and par value methods.
- PV function for present value calculations
- RATE function for yield-to-maturity
- Par value and dividend input fields
 Personal Finance & Loans
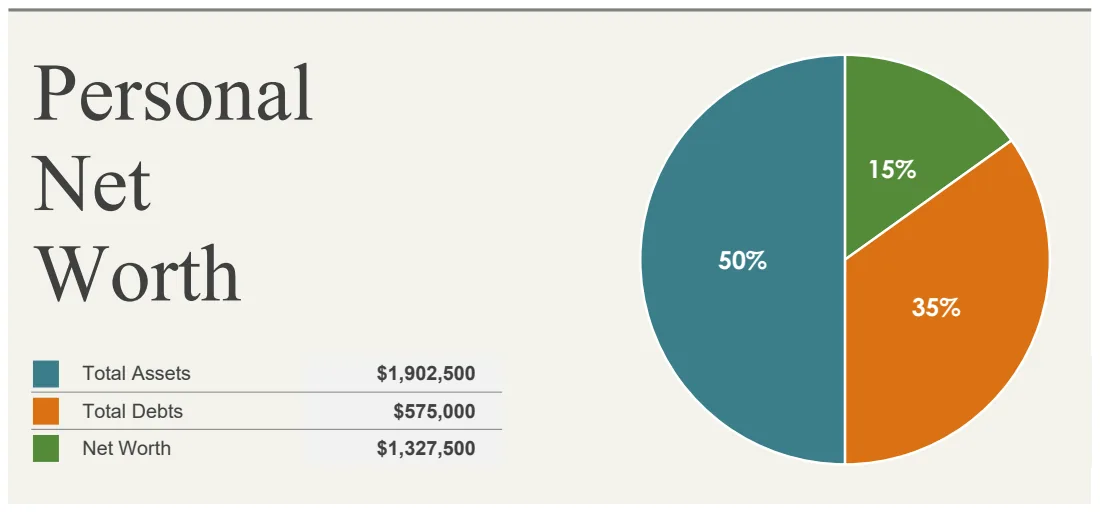
Personal Net Worth Calculator
Track your total assets and debts to calculate and monitor your net worth over time.
- Organized asset categories with individual line items
- Debt tracking by category
- Automatic net worth calculation
 Personal Finance & Loans
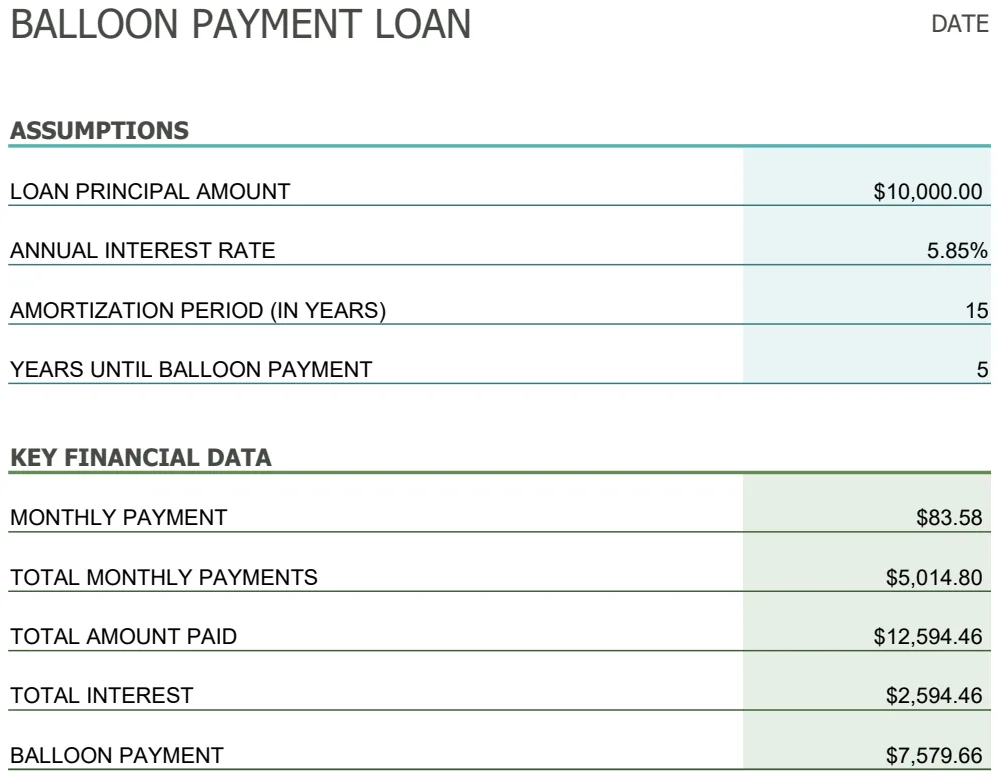
Balloon Loan Payment Calculator
Calculate monthly payments and track balloon loan schedules with customizable terms and final lump-sum payoffs.
- Customizable loan principal and interest rate
- Monthly payment calculation using PMT function
- Balloon payment amount at loan maturity