Fix your real estate investment spreadsheet errors
Don't treat your real estate investment analysis spreadsheet as a simple calculator; it's a dynamic model.
The most common mistake people make with a real estate investment analysis spreadsheet is treating it as a simple calculator. It's more of a dynamic model, built to test assumptions and reveal potential pitfalls before you commit capital. A well-constructed real estate investment analysis spreadsheet should do more than just spit out a cap rate; it should force you to think critically about income, expenses, financing, and exit strategies.
To effectively analyze a property, you need to consider multiple scenarios, not just your most optimistic projection. This means building in flexibility to adjust vacancy rates, repair costs, or market rents. For instance, if you're evaluating a multi-unit property, you might want to model scenarios with one unit vacant versus two. This kind of foresight prevents nasty surprises down the line.
Building Your Real Estate Investment Analysis Spreadsheet
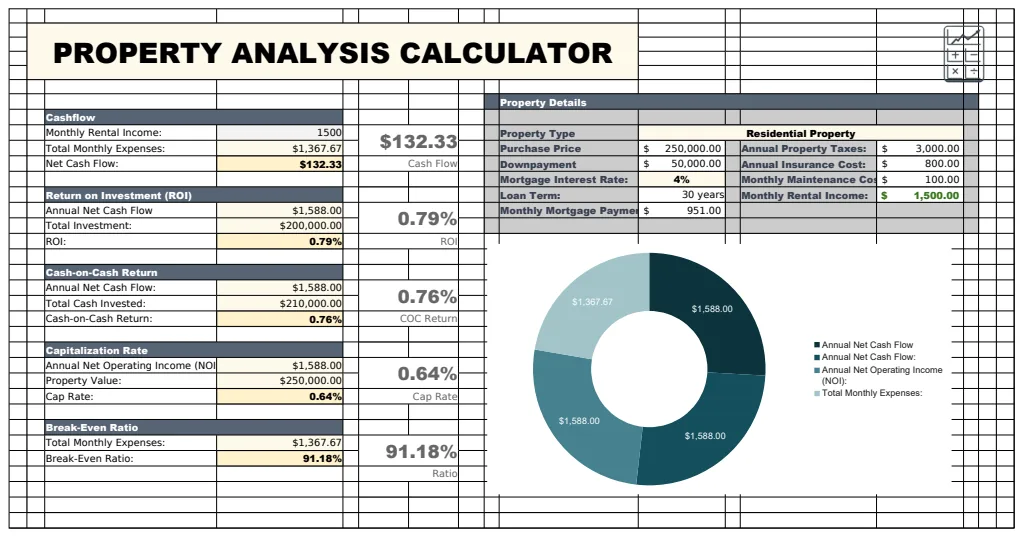
Let's construct a basic framework. You can start with a blank sheet in Excel or Google Sheets, or use a template to get a head start. A good template, like the Property Analysis Calculator Template, can save you hours of setup.
Your spreadsheet should be organized into distinct sections:
- Property Details: Address, property type, number of units, purchase price, closing costs.
- Income Projections: Gross potential rent, vacancy loss, other income (e.g., laundry, parking).
- Expense Projections: Property taxes, insurance, repairs and maintenance, property management fees, utilities, HOA fees (if applicable), administrative costs.
- Financing: Loan amount, interest rate, loan term, down payment.
- Operating Statement: This section pulls income and expense data to calculate Net Operating Income (NOI).
- Cash Flow Analysis: This shows your actual cash in hand after debt service.
- Investment Metrics: Cap Rate, Cash-on-Cash Return, Internal Rate of Return (IRR), Return on Investment (ROI).
- Exit Strategy: Projected sale price, selling costs, and net proceeds.
Income and Expense Forecasting
Accurate forecasting is key. For income, start with current market rents and be realistic about vacancy. A common figure is 5-10% vacancy, but this varies by market and property type. Don't forget "other income" sources that many investors overlook.
Expenses are where many analysis spreadsheets fall short. Property taxes are often fixed for a period, but insurance can fluctuate. Repairs and maintenance are notoriously underestimated; budget at least 1% of the property value annually, or more for older buildings. Property management fees are typically 8-12% of collected rent.
Structuring Your Formulas
Use clear labels for each row and column. For example, in your "Income" section:
- Column A: Item (e.g., "Gross Potential Rent", "Vacancy Loss")
- Column B: Annual Amount
Formulas should be robust. For vacancy loss, you might use =B2 * 0.08 where B2 is your Gross Potential Rent and 0.08 represents an 8% vacancy rate. This makes it easy to adjust the vacancy percentage later.
The NOI calculation is critical: =SUM(Income_Range) - SUM(Expense_Range). This figure is vital because it represents the property's profitability before financing costs.
For cash flow, it's =NOI - Annual_Debt_Service. Annual Debt Service is calculated using the PMT function or by simply multiplying your monthly mortgage payment by 12.
Key Investment Metrics
- Capitalization Rate (Cap Rate):
NOI / Purchase Price. This is a quick measure of unleveraged return. A higher cap rate generally indicates a more attractive investment, assuming comparable risk. - Cash-on-Cash Return:
Annual Cash Flow / Total Cash Invested. This shows the return on your actual out-of-pocket money, including the down payment and closing costs. This is often the most important metric for investors using leverage. - Internal Rate of Return (IRR): This is a more complex metric that calculates the discount rate at which the net present value of all cash flows (including the sale proceeds) equals zero. It accounts for the time value of money. You'll typically use Excel's or Google Sheets'
IRRfunction, providing a range of cash flows over several years.
Scenario Planning and Sensitivity Analysis
This is where a real estate investment analysis spreadsheet truly shines. Instead of one set of numbers, build in cells where you can input different assumptions for key variables like vacancy, rent growth, or interest rates. Use these inputs to drive your calculations.
For instance, you might have a table showing Cash-on-Cash Return under three scenarios: "Conservative" (e.g., 10% vacancy, 3% rent growth), "Base Case" (e.g., 7% vacancy, 4% rent growth), and "Optimistic" (e.g., 3% vacancy, 5% rent growth). This helps you understand the potential range of outcomes.
Common Mistakes to Avoid
- 01Underestimating Expenses: This is the most frequent error. People often forget property management fees, capital expenditures (roof, HVAC replacement), or even basic utilities for vacant units. Always pad your expense estimates.
- 02Overestimating Income: Assuming rents will always be at market rate, or that you'll achieve 100% occupancy, is unrealistic. Build in a vacancy buffer from day one.
- 03Ignoring Closing Costs and Holding Costs: The purchase price is only one part of your initial investment. You must account for loan origination fees, appraisal costs, title insurance, legal fees, and any costs to get the property ready for rent.
- 04Not Projecting Future Expenses: Property taxes often increase after reassessment, insurance premiums can rise, and major capital items will need replacement over time. Your analysis should look beyond year one.
- 05Forgetting the Exit: How will you sell the property? What are the estimated selling costs (broker commissions, closing costs)? Understanding your potential net proceeds upon sale is crucial for calculating your total ROI.
Advanced Features for Your Spreadsheet
Once you have the basics down, consider adding these elements:
- Loan Amortization Schedule: A separate table showing principal and interest payments over the life of the loan. This helps verify your debt service calculation.
- Capital Expenditure Tracking: A section to list upcoming major repairs and their estimated costs.
- Rent Roll Analysis: If you're looking at a multi-unit property, a detailed rent roll can help you see current income per unit and track lease expirations. The Rental Property Cash Flow Analysis template can help manage this across multiple units.
- Taxes and Depreciation: While complex, incorporating depreciation can significantly impact your after-tax returns. This is often best handled in dedicated tax software or with professional advice, but a basic estimate can be included.
- Market Comparables: A small section to note recent sales of similar properties in the area can help justify your projected sale price.
Frequently Asked Questions
How granular should my expense categories be?
Aim for enough detail to be meaningful, but not so much that it becomes overwhelming. For example, instead of just "Repairs," you might have "Plumbing," "Electrical," "General Maintenance." However, for a smaller property, a single "Repairs & Maintenance" line item with a healthy budget might suffice, especially if you use a template like the Property Cashflow Calculator Template which offers clear expense tracking.
What's the most important metric to focus on?
This depends on your investment strategy. For buy-and-hold investors focused on monthly income, Cash-on-Cash Return is paramount. For those looking for long-term appreciation and considering refinancing or selling, IRR becomes more critical as it accounts for the time value of money and the full holding period.
Can I use this for commercial properties?
Yes, the core principles apply, but the specifics change significantly. Commercial leases are more complex, expenses are often passed through to tenants (NNN leases), and tenant credit risk is a major factor. You'll need to adapt the income and expense sections considerably. A general-purpose real estate investment analysis spreadsheet might need substantial modification or a specialized template for commercial assets.
How often should I update my analysis?
You should update your analysis whenever key assumptions change or when you are considering a new property. For properties you already own, review your performance against projections quarterly or annually. This helps you identify areas where expenses are higher than expected or income is lower, allowing you to take corrective action. If you're constantly building new models, consider our library of templates, available for a one-time fee of $9 for unlimited downloads.