Google Sheets inventory tracking: a foolproof starter guide
Discover how a robust inventory tracking spreadsheet in Google Sheets can transform stock chaos into order and provide valuable insights.
The moment you realize you can't quickly answer "How much do we have of Product X?" is when a robust inventory tracking spreadsheet Google Sheets becomes essential. This usually happens during a busy sales period, a surprise audit, or when a customer asks for an out-of-stock item. Without a clear system, stock counts become guesswork, leading to overstocking, stockouts, and lost revenue.
A well-structured Google Sheet can transform this chaos into order. It’s about more than just listing items; it's about creating a dynamic system that reflects real-time stock levels, tracks movement, and provides valuable insights into your inventory's value and turnover. This approach prevents the common pitfalls of manual tracking, such as data entry errors and outdated information.
Setting Up Your Core Inventory Sheet
Start with a new Google Sheet. The foundation of any good inventory tracking spreadsheet Google Sheets is a clear, well-organized item master list. You'll need columns that capture critical details for each product.
Consider these essential columns:
- SKU (Stock Keeping Unit): A unique identifier for each product variation. This is crucial for avoiding confusion.
- Product Name: A descriptive name for the item.
- Category: Grouping items by type (e.g., "Apparel," "Electronics," "Supplies").
- Supplier: Who you purchase the item from.
- Unit Cost: The cost to acquire one unit of the item.
- Sale Price: The price at which you sell one unit.
- Initial Stock: The quantity you started with.
- Stock In: A column to record incoming inventory.
- Stock Out: A column to record outgoing inventory.
- Current Stock: This will be a calculated field.
- Minimum Stock Level: The reorder point for this item.
- Location: Where the item is stored (e.g., "Warehouse A," "Shelf B-3").
- Total Stock Value: Another calculated field.
Calculating Current Stock Levels
The heart of your inventory management lies in accurately calculating your current stock. This is where formulas come into play. In the "Current Stock" column (let's say it's column J), you'll use a formula that subtracts "Stock Out" from "Stock In," then adds the "Initial Stock."
If your "Initial Stock" is in column H, "Stock In" in column I, and "Stock Out" in column J, and you want "Current Stock" in column K, the formula for cell K2 (assuming your data starts on row 2) would be:
=H2 + I2 - J2
You can then drag this formula down to apply it to all your product rows.
For a more advanced setup that handles multiple inbound and outbound transactions, you might want separate sheets for "Stock In" and "Stock Out" transactions. You could then use SUMIFS to pull totals into your main inventory sheet. For example, if you have a "Transactions" sheet with columns for "SKU," "Type" (In/Out), and "Quantity," your "Current Stock" formula might look like this:
=H2 + SUMIFS(Transactions!$E:$E, Transactions!$A:$A, A2, Transactions!$B:$B, "In") - SUMIFS(Transactions!$E:$E, Transactions!$A:$A, A2, Transactions!$B:$B, "Out")
Here, A2 is the SKU in your main inventory sheet, and E:E and A:A and B:B are columns in your "Transactions" sheet holding Quantity, SKU, and Type respectively.
Tracking Stock In and Stock Out Transactions
To maintain accurate "Current Stock" figures, you need a system for recording every movement of inventory. It's best to have separate sheets dedicated to tracking "Stock In" and "Stock Out" transactions.
Stock In Sheet
This sheet should log when new inventory arrives. Key columns here would be:
- Date: When the stock was received.
- SKU: The unique identifier of the item.
- Product Name: For easy reference.
- Quantity Received: The number of units added.
- Supplier: Who sent the stock.
- Invoice/PO Number: Reference for the transaction.
- Notes: Any relevant details.
Each time you receive new stock, you add a new row here. The "Quantity Received" from this sheet will be summed up to update the "Stock In" column on your main inventory sheet using a formula like =SUMIFS('Stock In'!D:D, 'Stock In'!B:B, A2).
Stock Out Sheet
Similarly, this sheet logs when inventory leaves. Useful columns include:
- Date: When the item was removed.
- SKU: The unique identifier.
- Product Name: For clarity.
- Quantity Removed: The number of units taken out.
- Reason: (e.g., "Sale," "Damaged," "Internal Use," "Return to Vendor").
- Customer/Department: Who or what received the item.
- Order Number/Reference: Link to the sale or request.
Each outgoing transaction gets a row here. The "Quantity Removed" will feed into the "Stock Out" column on your main sheet: =SUMIFS('Stock Out'!D:D, 'Stock Out'!B:B, A2).
Calculating Total Stock Value
Knowing the value of your inventory is critical for financial reporting and understanding your business's assets. On your main inventory sheet, add a "Total Stock Value" column (e.g., column M).
The formula for this column, assuming "Current Stock" is in K and "Unit Cost" is in G, would be:
=K2 * G2
This formula multiplies the number of units you currently have by the cost of each unit to give you the total value tied up in that specific product. Summing this column at the bottom of your sheet will give you your total inventory value. This is a key metric, and having it automatically calculated in your inventory tracking spreadsheet Google Sheets saves immense time.
Setting Up Reorder Alerts with Conditional Formatting
Preventing stockouts is a primary goal. You can use conditional formatting in your main inventory sheet to visually flag items that are running low.
- 01Select the "Current Stock" column (e.g., column K).
- 02Go to Format > Conditional formatting.
- 03Under "Format rules," choose "Less than or equal to."
- 04In the "Value or formula" field, enter a reference to your "Minimum Stock Level" column. If "Minimum Stock Level" is column L, you’d enter
=L2. - 05Choose a formatting style, such as a light red fill.
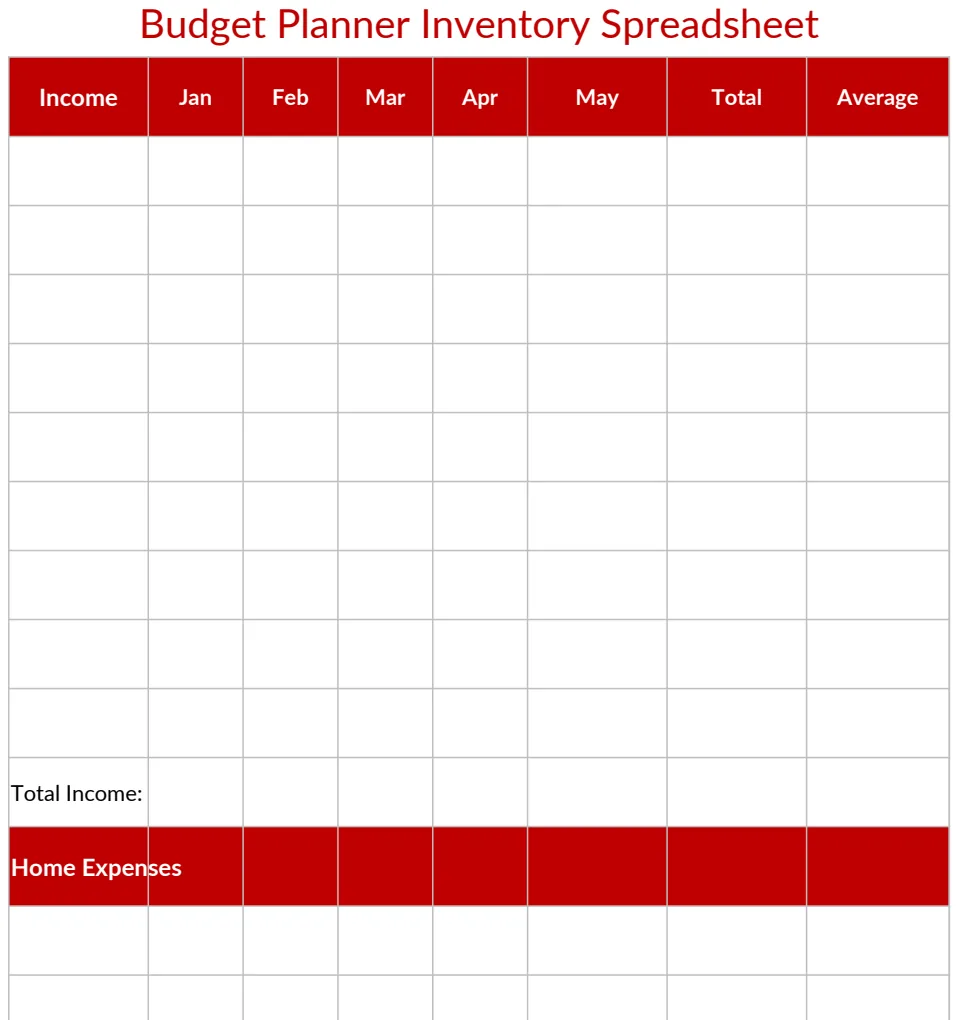
Now, any cell in the "Current Stock" column that shows a quantity less than or equal to its corresponding minimum stock level will automatically be highlighted, acting as an instant reorder alert. This proactive approach is a hallmark of an effective inventory tracking spreadsheet Google Sheets. If you need a more comprehensive way to manage your budget alongside inventory, consider a template like the Budget Planner Inventory Spreadsheet.
Common Mistakes to Avoid
Many users stumble when setting up or maintaining their inventory tracking spreadsheets. Be mindful of these common errors:
- Inconsistent SKUs: Using slightly different SKUs for the same product (e.g., "RED-SHIRT-M" vs. "RED SHIRT M"). This breaks your ability to accurately sum quantities. Stick to a strict naming convention.
- Not Recording Every Transaction: Even small movements matter. If stock is moved between locations within your facility, or if a few items are used for internal testing, these should be logged to maintain accuracy.
- Forgetting to Update Unit Costs: If your supplier increases prices, failing to update the "Unit Cost" column will lead to an inaccurate "Total Stock Value." Regularly review and update your cost data.
- Over-reliance on a Single "Current Stock" Column: While useful, this column is a result of other data. If your "Stock In" or "Stock Out" logs are incomplete, the "Current Stock" number will be wrong, no matter how sophisticated the formula. The integrity of the transaction logs is paramount.
- No "Minimum Stock Level" Defined: Without a reorder point, you're flying blind. Define this for each item based on lead times and sales velocity.
- Using Formulas That Don't Scale: Be careful with absolute vs. relative cell references. If you drag a formula down and it stops referencing the correct columns, your data will be skewed. Always test formulas thoroughly.
- Lack of Regular Audits: Even the best spreadsheet system needs physical verification. Schedule regular stock counts (cycle counts or full physical inventories) to catch discrepancies and correct your sheet.
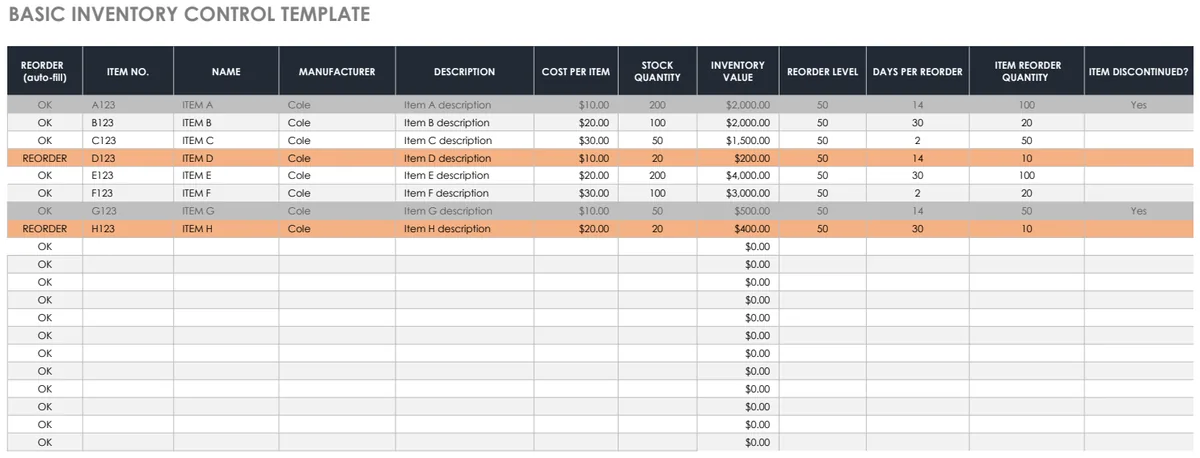
For more structured tracking of stock levels and vendor management, the Stock Inventory Control template offers advanced features.
Advanced Features and Next Steps
Once your core inventory tracking spreadsheet Google Sheets is functional, you can explore enhancements:
Tracking Inventory Value Over Time
You can create a separate sheet or section to track your total inventory value on a weekly or monthly basis. This requires taking a snapshot of your "Total Stock Value" column at regular intervals. You can do this manually or, with a bit more advanced use of scripts, automate it. This historical data is invaluable for understanding trends, cash flow tied up in inventory, and the impact of sales promotions.
Using XLOOKUP for Easier Data Entry
If you have separate lists for product names based on SKUs, XLOOKUP can simplify data entry. For instance, if your main sheet has SKU in column A and you want to auto-populate Product Name in column B, and you have a separate "Product List" sheet with SKUs in column A and Names in column B, the formula in B2 would be:
=XLOOKUP(A2, 'Product List'!A:A, 'Product List'!B:B, "Not Found")
This pulls the correct product name automatically, reducing typing errors.
Managing Multiple Locations
If you store inventory in multiple places, add a "Location" column to your main sheet and potentially to your transaction sheets. You can then use filtering or pivot tables to see stock levels by location, which is crucial for fulfillment and managing warehouse space. For tracking items that are borrowed or loaned out, an Inventory Sign In and Out Sheet Template can be very effective.
When to Consider Dedicated Software
While a Google Sheet can handle a surprising amount of complexity, there comes a point where dedicated inventory management software might be more efficient. This is typically when you have a very high volume of SKUs, complex multi-warehouse operations, or need integration with e-commerce platforms or accounting software. However, for many small to medium businesses, a well-maintained spreadsheet remains a powerful and cost-effective solution.
### What if I have many product variations (e.g., size, color)?
Handle variations by creating unique SKUs for each combination. For example, a T-shirt might have SKUs like "TS-RED-M" (T-Shirt, Red, Medium) and "TS-RED-L" (T-Shirt, Red, Large). Each of these gets its own row in your inventory tracking spreadsheet Google Sheets, with its own "Current Stock" and "Minimum Stock Level." This ensures you track each specific variant accurately.
### How often should I update my inventory sheet?
Ideally, you should update your inventory sheet daily, or even in real-time if possible, especially for the "Stock In" and "Stock Out" transactions. If you can't do it daily, aim for at least weekly updates for transactional data. Your "Current Stock" and "Total Stock Value" columns will then be based on the most recent data. Regular physical stock counts (monthly or quarterly, depending on your business volume) are also essential to verify the accuracy of your sheet.
### Can I use this for more than just physical products?
Yes, the principles of an inventory tracking spreadsheet Google Sheets can be adapted for digital assets or even services, though the terminology might change. For instance, you could track licenses for software, service contracts, or even the availability of specific skilled personnel. The core concept remains tracking quantities, costs, and movement of a finite resource.