Plan retirement savings in an hour with Excel
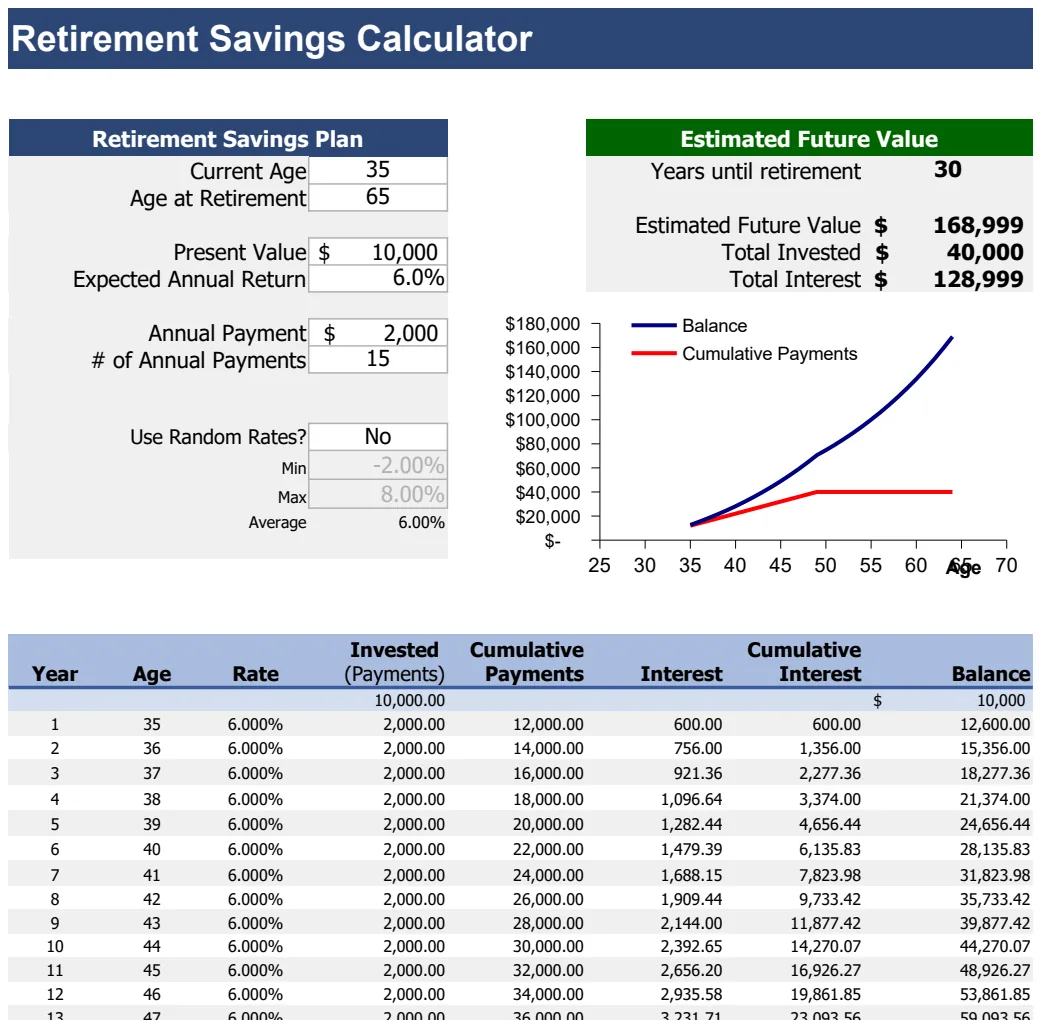
Build a dynamic retirement savings calculator Excel template to visualize your financial future and track your progress.
By the end of this, you'll have a functioning retirement savings calculator Excel template that projects your nest egg growth, accounts for contributions, and shows you potential retirement dates. You can start with a basic model and expand it to include variables like inflation, investment returns, and withdrawal rates.
This isn't about guesswork; it's about building a dynamic tool to visualize your financial future. A well-constructed retirement savings calculator Excel template can be the difference between wondering if you're on track and knowing you are, or knowing precisely when you'll need to adjust your savings strategy. It helps you see the impact of small changes today on your long-term security.
Setting Up Your Basic Calculator
Let's start with the core components. You'll need columns for:
- Current Age: Your age today.
- Retirement Age: The age you plan to retire.
- Current Savings: The amount you currently have saved for retirement.
- Annual Contribution: The total amount you plan to save each year.
- Assumed Annual Return (%): The average annual growth rate you expect from your investments.
- Inflation Rate (%): The annual rate at which prices are expected to increase.
- Annual Withdrawal Rate (%): The percentage of your total savings you plan to withdraw each year in retirement.
For illustrative purposes, let's assume you're 35, plan to retire at 65, have $100,000 saved, contribute $15,000 annually, assume a 7% annual return, a 3% inflation rate, and a 5% withdrawal rate.
Projecting Savings Year-by-Year
To see how your savings grow, you'll create a projection table. This table will typically start the year after your current age and run up to your planned retirement age. Each row represents one year.
Here’s how the calculations for each year would look:
- 01Starting Balance: This is the ending balance from the previous year. For the first year of your projection, it's your "Current Savings."
- 02Contributions: This is your "Annual Contribution." You can adjust this to increase or decrease over time if you anticipate salary raises or changes in your savings habits. For a simple model, keeping it constant is fine.
- 03Pre-Inflation Growth: Calculate the growth of your savings before accounting for inflation. The formula would be:
(Starting Balance + Contributions) * (1 + Assumed Annual Return). - 04Inflation Adjustment: Apply the inflation rate. This is crucial for understanding the real purchasing power of your money. The formula is:
Pre-Inflation Growth / (1 + Inflation Rate). This adjusted figure represents your balance in terms of today's dollars. - 05Ending Balance: This is your "Inflation Adjusted Growth" amount. This is the figure you'll carry forward as the "Starting Balance" for the next year.
Let's walk through the first projected year (Age 36) with our example numbers:
- Starting Balance: $100,000
- Contributions: $15,000
- Pre-Inflation Growth: ($100,000 + $15,000) * (1 + 0.07) = $115,000 * 1.07 = $123,050
- Inflation Adjustment: $123,050 / (1 + 0.03) = $119,466.02
- Ending Balance (Age 36): $119,466.02
You would then copy these formulas down for each subsequent year until you reach your projected retirement age.
Calculating Retirement Income Needs
Once you have your projected savings at retirement age, you need to estimate how much income you'll need. A common approach is to use a withdrawal rate.
If your projected balance at retirement is $800,000 and you plan to withdraw 5% annually, your initial retirement income would be $40,000. However, this $40,000 needs to maintain its purchasing power throughout your retirement.
You can project your annual income needs by applying the inflation rate to your initial withdrawal amount for each year you expect to be retired. For example, in the second year of retirement, your income need would be $40,000 * (1 + 0.03) = $41,200.
Visualizing Your Progress with Charts
Numbers are powerful, but charts make them understandable. A line chart showing your projected savings growth over time is incredibly motivating.
- 01Select Data: Highlight your projected ages and their corresponding ending balances.
- 02Insert Chart: Go to Insert > Chart. Choose a Line Chart.
- 03Customize: Add titles for your axes (e.g., "Age" for the horizontal, "Savings Balance (Today's Dollars)" for the vertical) and a clear chart title like "Projected Retirement Savings Growth."
You can also create a separate chart to visualize your projected annual retirement income needs versus your potential income from savings. This helps identify any shortfalls.
Incorporating Advanced Variables
A truly robust retirement savings calculator Excel template will go beyond these basics. Consider adding:
- Variable Investment Returns: Instead of a fixed annual return, you could use a more complex model that accounts for market volatility, perhaps using Monte Carlo simulations (though this requires advanced Excel skills or VBA).
- Taxes: Factor in taxes on investment growth and withdrawals. This significantly impacts your net retirement income.
- Social Security Estimates: Integrate projected Social Security benefits to reduce the amount you need to draw from your savings.
- Lump Sums or Windfalls: Add the ability to include one-time contributions.
- Different Withdrawal Strategies: Model scenarios where you withdraw more in early retirement and less later, or vice versa.
For those who want a ready-made, feature-rich solution, templates like the Retirement Savings Calculator can save considerable setup time. They often include pre-built charts and more sophisticated calculation options.
Common Mistakes to Avoid
- Overly Optimistic Return Assumptions: Using a 10% or 12% annual return is rarely sustainable over decades. Stick to more conservative, historically validated figures like 7% or 8% for long-term projections.
- Forgetting Inflation: Projecting your savings in nominal dollars (without accounting for inflation) will give you a wildly inflated sense of your future purchasing power. Always adjust for inflation to see what your money will actually buy.
- Underestimating Retirement Duration: People are living longer. Assume a retirement that lasts at least 25-30 years, or even longer, depending on your health and family history.
- Not Factoring in Healthcare Costs: Healthcare expenses can be a significant and unpredictable part of retirement. While hard to model precisely, acknowledge this potential cost.
- Ignoring Taxes: Taxes on investment gains and withdrawals can significantly reduce the amount of money you actually have available to spend.
- Not Updating the Plan: Your life circumstances change. Revisit and update your retirement savings calculator Excel template at least annually, or whenever a major life event occurs.
Expanding Your Financial Planning
How to Calculate the Number of Years Until Retirement
To find the number of years until retirement, you can simply subtract your "Current Age" from your "Retirement Age." In Excel, if your current age is in cell A2 and your retirement age is in cell B2, the formula would be =B2-A2. This will give you the number of years you have left to save and invest.
What if I want to see how much I need to save per month?
If you know your target retirement savings amount, your projected retirement age, and your assumptions for investment returns and inflation, you can work backward. Many templates, including the Retirement Calculator, are designed to solve for this. You'd typically input your target savings goal, current age, retirement age, current savings, and assumed returns, and the template would calculate the required annual or monthly contribution.
Can I model different retirement ages?
Absolutely. The beauty of a spreadsheet model is its flexibility. If your retirement age is in cell B2, you can easily change that number to 63, 67, or any other age. The projection table will automatically recalculate based on the new retirement year, showing you the impact of retiring earlier or later on your total savings and income. This is a powerful way to explore different scenarios and make informed decisions.
Where can I find pre-built templates?
If building a complex retirement savings calculator Excel template from scratch feels daunting, there are many excellent resources available. The OpenWorksheet library offers several options, such as the Retirement Calculator or the Retirement Calculator 3. These templates are designed to handle the intricate calculations and visualizations, allowing you to input your personal data and get immediate insights. The entire library is available for a one-time fee of $9, offering unlimited downloads.