Why your blogger income expense tracker spreadsheet is lying
Your blogger income expense tracker spreadsheet might be misleading you. Learn how to build one that accurately reflects your blog's financial health.
By the end of this, you'll have a functional blogger income expense tracker spreadsheet that automatically sums your revenue streams and categorizes your deductible costs, giving you a clear picture of your profitability each month. This isn't just about recording numbers; it's about building a tool that tells you where your blogging business truly stands financially.
You're likely wrestling with how to properly account for diverse income sources, affiliate marketing, sponsored posts, digital product sales, ad revenue, and the many expenses that come with running a blog. Without a structured system, it's easy for money to slip through the cracks, both in terms of missed income opportunities and uncaptured deductions. A well-designed blogger income expense tracker spreadsheet changes that.
Setting Up Your Core Tracker Sheet
Let's start by building the foundation. Open a new Google Sheet or Excel workbook. Rename the first sheet "Transactions." This sheet will be your data entry hub. You'll need at least the following columns:
- Date: The date the transaction occurred.
- Description: A brief note about the income or expense (e.g., "Affiliate commission - Amazon," "Web hosting renewal," "Guest post payment - Brand X").
- Category: This is crucial for analysis. Create a consistent list. For income, think "Affiliate Marketing," "Sponsored Content," "Digital Products," "Ad Revenue." For expenses, consider "Website Hosting," "Email Marketing," "Software Subscriptions," "Office Supplies," "Travel," "Professional Development."
- Sub-Category: Optional, but helpful for more granular tracking. For example, under "Software Subscriptions," you might have "Email Marketing Tool," "Graphic Design Software."
- Income: Enter positive numbers here for revenue.
- Expense: Enter positive numbers here for costs.
It’s vital to be consistent with your categories. If you use "Web Hosting" one month and "Hosting" the next, your summary reports will be less accurate.
Building Your Categories List
To ensure consistency in your "Category" and "Sub-Category" columns, it’s best to set up a separate sheet for your master lists. Create a new sheet named "Lists." In column A, list all your income categories. In column B, list all your expense categories. You can also add sub-categories here.
Then, back on your "Transactions" sheet, you can use data validation to create dropdown menus for your Category and Sub-Category columns. Select the cells in the "Category" column where you want the dropdown, go to Data > Data validation, and choose "List from a range." Point it to your "Lists" sheet, column A (or whichever column holds your categories). Repeat for Sub-Category, pointing to its respective column. This prevents typos and ensures uniform data entry.
Automating Income Summaries
Now, let's make your data work for you. Create a new sheet named "Income Summary." This sheet will pull data from your "Transactions" sheet.
You'll want a row for each income category you defined. In column A, list your income categories (e.g., "Affiliate Marketing," "Sponsored Content"). In column B, you'll use a formula to sum the income from that category. A SUMIF or SUMIFS formula is perfect here.
For example, if your "Transactions" sheet has dates in column A, descriptions in B, categories in C, and income in F, the formula in cell B2 of your "Income Summary" sheet (assuming "Affiliate Marketing" is listed in A2) would look something like this:
=SUMIF(Transactions!C:C, A2, Transactions!F:F)
This formula tells the spreadsheet to look at column C on the "Transactions" sheet, find any cells that match the category listed in A2 of the "Income Summary" sheet, and then sum the corresponding values from column F (your income column) on the "Transactions" sheet. Drag this formula down for all your income categories.
Automating Expense Summaries
Similar to your income summary, create an "Expense Summary" sheet. List your expense categories in column A. In column B, use a SUMIF formula to sum expenses for each category.
If your "Transactions" sheet has expenses in column G, the formula in cell B2 of your "Expense Summary" sheet (assuming "Website Hosting" is in A2) would be:
=SUMIF(Transactions!C:C, A2, Transactions!G:G)
Again, drag this formula down for all your expense categories.
Calculating Profitability
With income and expense summaries in place, you can easily calculate your net profit. On your "Income Summary" sheet, you can add a row at the bottom for "Total Income." Use a simple =SUM(B2:Bxx) formula (where Bxx is the last cell with an income total). Do the same for "Total Expense" on your "Expense Summary" sheet.
Then, create a "Profit & Loss" sheet. In cell A1, type "Total Income." In cell B1, link to your total income cell from the "Income Summary" sheet. In cell A2, type "Total Expenses." In cell B2, link to your total expense cell from the "Expense Summary" sheet. In cell A3, type "Net Profit." In cell B3, enter the formula =B1-B2. This gives you a clear, at-a-glance view of your blog's profitability.
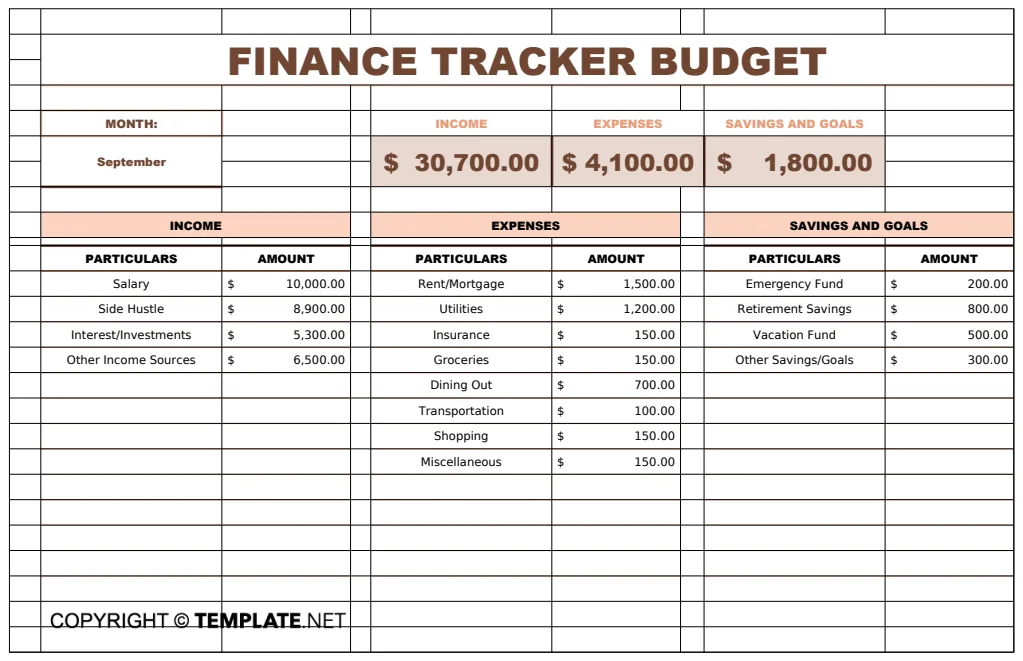
For a more robust financial overview that includes budget comparisons, you might find a template like the Finance Tracker Budget Template helpful, as it's designed to track income and expenses against planned budget amounts.
Tracking Over Time: Monthly Snapshots
To see how your blog performs month over month, you can duplicate your "Income Summary" and "Expense Summary" sheets for each month. Name them "January Summary," "February Summary," and so on.
Within each monthly summary sheet, you’ll need to adjust your SUMIF formulas to only pull transactions from that specific month. You can do this by adding another condition to your SUMIFS formula, checking the date column.
For example, on your "January Summary" sheet, if your "Transactions" sheet has dates in column A, categories in C, and income in F, the formula for "Affiliate Marketing" (in A2) would become:
=SUMIFS(Transactions!F:F, Transactions!C:C, A2, Transactions!A:A, ">=2026-01-01", Transactions!A:A, "<=2026-01-31")
This formula sums income from column F where the category matches A2, AND the date in column A is between January 1st and January 31st, 2026. You'd adjust the dates for each month. This approach allows you to build a historical performance record.
Common Mistakes to Avoid
- Inconsistent Categorization: As mentioned, using variations like "Hosting" and "Web Hosting" splits your data. Stick to your master list.
- Not Tracking Everything: It's tempting to skip small expenses, but these add up. Also, don't forget to log all income sources.
- Ignoring Deductions: Bloggers have many potential write-offs. If you're not tracking them systematically, you could be missing out on significant tax savings.
- Over-Complicating Formulas: Start with
SUMIFandSUMIFS. While more advanced formulas exist, these are usually sufficient for a blogger income expense tracker spreadsheet and are easier to manage. - Not Backing Up: Your spreadsheet is your financial record. Ensure you have regular backups. Cloud-based solutions like Google Sheets do this automatically.
Advanced Features and Next Steps
Using Conditional Formatting
Highlighting key figures can make your summaries more readable. On your "Profit & Loss" sheet, you could use conditional formatting to make the "Net Profit" cell turn green if it's positive and red if it's negative. Select the cell, go to Format > Conditional formatting, and set up rules based on its value.
Tracking Mileage
If you travel for blogging-related events or client meetings, track your mileage separately. Add columns to your "Transactions" sheet for "Miles Driven" and "Purpose." You can then create a separate summary for mileage expenses, multiplying total miles by the current IRS rate.
Setting Up a Dashboard
For a high-level overview, consider creating a "Dashboard" sheet. This sheet can pull key metrics from your monthly summaries and P&L reports using simple cell references or more advanced formulas like INDEX and MATCH or XLOOKUP. You could display total monthly income, total monthly expenses, net profit, and perhaps a simple chart showing income vs. expenses over the last few months. For more specialized tracking, like rental properties, a dedicated tool like the Rental Property Income and Expenses Tracker might be more appropriate.
What if I have multiple blogs?
If you run multiple distinct blogs, you'll want to adapt this system. You could add a "Blog Name" column to your "Transactions" sheet and then use SUMIFS formulas on your summary sheets to filter by both category and blog name. Alternatively, you could create entirely separate sets of tracking sheets for each blog.
Can I track taxes owed?
Yes, you can. On your "Profit & Loss" sheet, add a line for "Estimated Tax." You'll need to determine an estimated tax rate based on your location and income bracket. The formula would be =B3 * TaxRate (where TaxRate is your estimated percentage, e.g., 0.25 for 25%). Remember this is an estimate; consult a tax professional for accurate figures.
What if I want to track my business assets?
This blogger income expense tracker spreadsheet focuses on operational income and expenses. For tracking assets (like a new laptop or camera equipment) and their depreciation, you would need a more comprehensive accounting system or a dedicated asset register. While this template is excellent for day-to-day operations, a full bookkeeping solution is recommended for long-term asset management.
The core benefit of having a dedicated blogger income expense tracker spreadsheet is clarity and control. By diligently logging and categorizing, you gain insights that drive smarter business decisions, helping your blog grow more profitably.